MAR 10-Yr T-NOTES
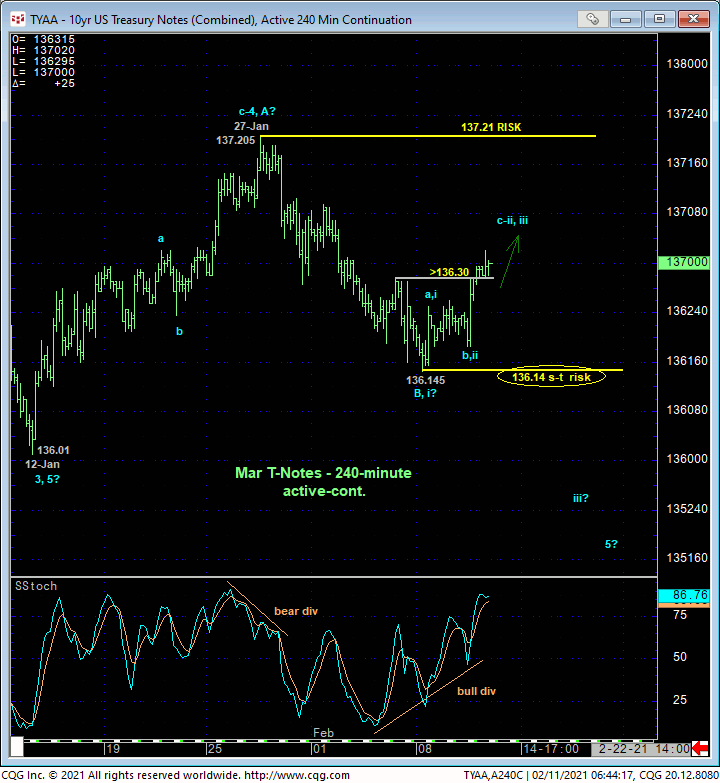
In yesterday morning’s Technical Blog we identified last Fri’s 136.295 high as the smaller-degree corrective high the market needed to sustain losses below to avoid confirming a bullish divergence in short-term momentum. The market’s recovery above this level yesterday afternoon confirms the divergence that defines Mon’s 136.145 low as the end of the decline from 27-Jan’s 137.205 key high and longer-term risk parameter. Per such, we’re defining 136.14 as our new short-term risk parameter from which non-bearish decisions like short-covers and cautious bullish punts can be objectively based and managed by shorter-term traders with tighter risk profiles.
The challenge now is discerning this week’s recovery as either a smaller-degree, intra-range corrective hiccup within the major downtrend OR a continuation of a larger-degree correction up from 12-Jan’s 136.01 low that could break 27-Jan’s 137.205 high as part f a major correction of Aug-Jan’s entire 140.13 – 136.01 decline. A relapse below 136.14 will reinforce the former, bearish count while a trendy, impulsive break above 137.21 will confirm the latter, bullish count.
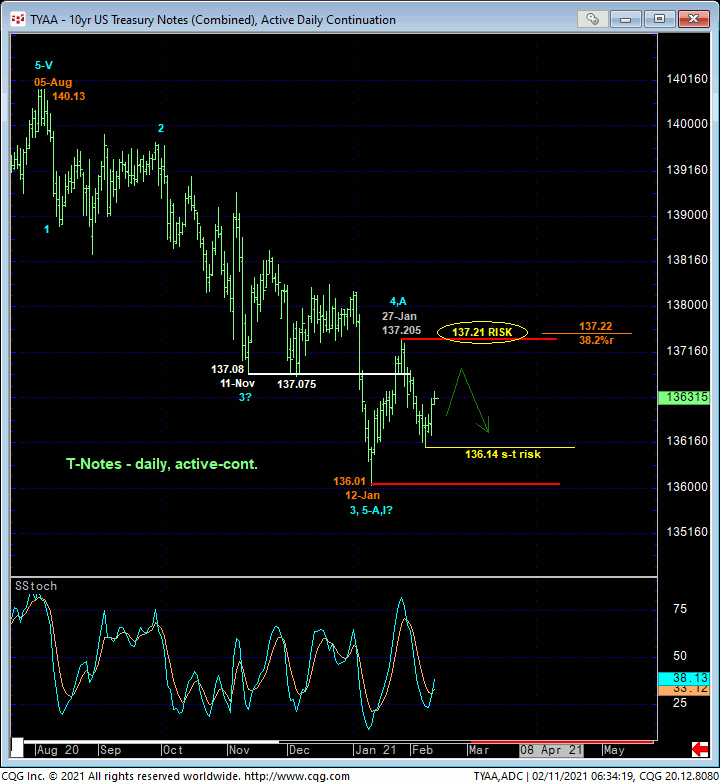
The daily chart of the contract above shows the magnitude of the major and arguably still-developing downtrend from 05Aug20’s 140.13 all-time high. A recovery above 27-Jan’s 137.205 high remains required to, in fact, conclude 12-Jan’s 136.01 low as the end of this decline and expose a larger-degree (B- or 2nd-Wave) correction higher that could span weeks or even months and reach well into the 138-handle or higher. Until such 137.21+ strength is proven however, it would be premature from a longer-term perspective to conclude this week’s rebound as anything more than a smaller-degree interruptive corrective hiccup within the past month’s thus far lateral range that’s easily considered a mere consolidation within the major downtrend. In effect, the short-term trend is up within the long-term trend that remains arguably down.
On a 10-yr yield basis shown in the daily log close-only chart below, the analogous longer-term risk parameter is defined by 27-Jan’s 1.018% corrective low. This is the minimum level the market needs to relapse below to arrest the SIX MONTH rate rise from 04-Aug’s 0.504% low and expose a larger-degree correction lower in rates.
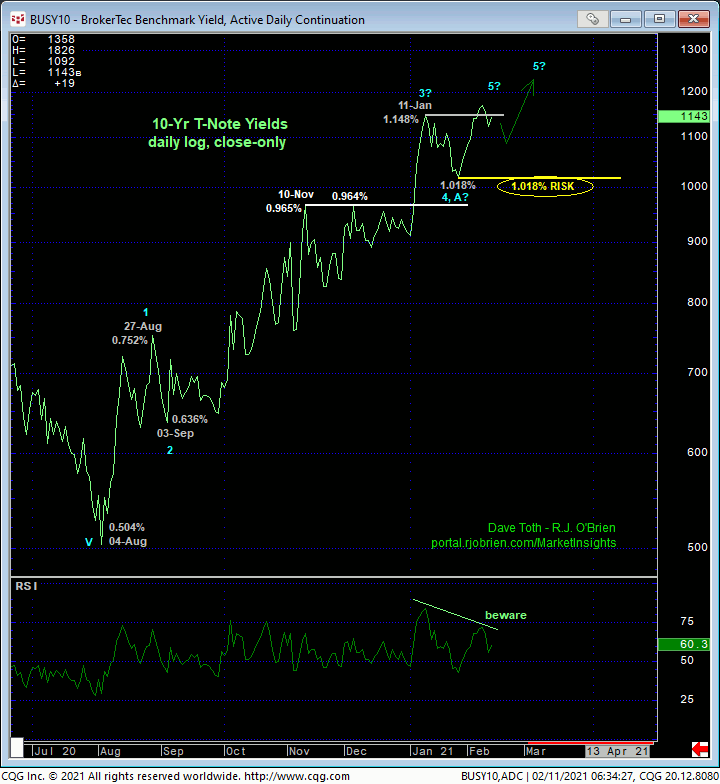
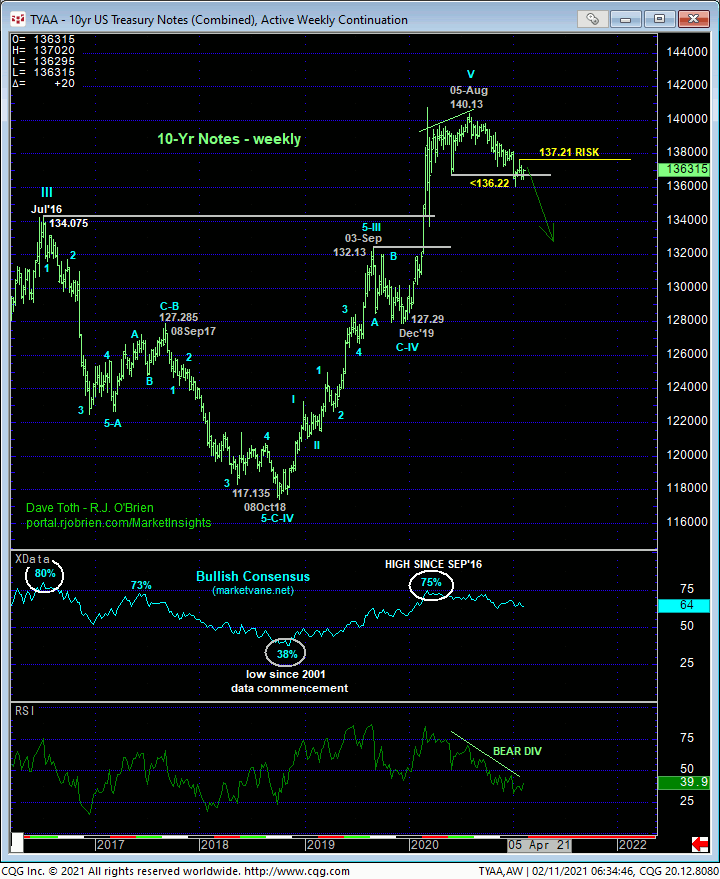
On an even broader basis, there’s n need to reiterate the momentum, sentiment and Elliott details introduced in 11Aug20’s Technical Webcast that introduced a major peak/reversal environment. This long-term peak/reversal count will remain intact until and unless last Aug’s 140.13 high is broken. This major peak/reversal process does allow for what could be an extensive B- or 2nd-Wave corrective rebound however IF the market recoups 137.21.
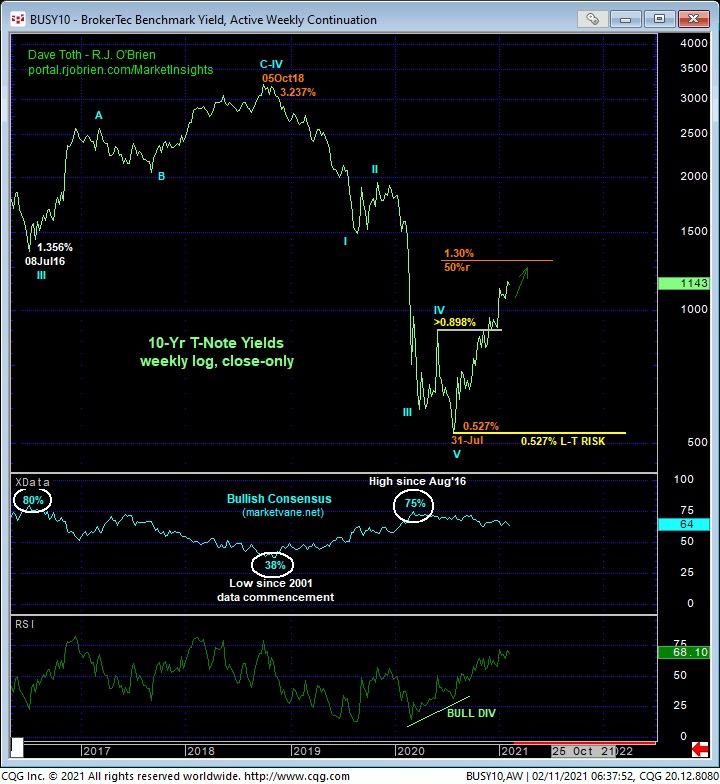
This major reversal count is even more obvious on a weekly log 10-yr basis below where the break of the nearly-two-year rate decline from Oct’18’s 3.237% high is crystal clear. The very interesting thing here is whether this Oct’18 – Jul’20 decline is the completing 5th-wave of a generation-long sequence that dates from 1981’s 15.84% high. This rate base/reversal process could easily span years before a recovery above Oct’18’s 3.261% major corrective high confirms the reversal of a 39-YEAR bear trend in rates.
These issues considered, a bearish policy and policy and exposure remain advised for longer-term institutional players with a recovery above 137.21 required to defer our bearish count enough to warrant moving to a neutral-to-cautiously-bullish stance. Shorter-term traders have been advised to move to a neutral/sideline position as a result of yesterday’s recovery above 136.30. The market’s position in the middle of the recent 136.01 – 137.21-range presents abhorrent risk/reward metrics however, so standing aside is advised for the time being. We will be watchful for an intra-range recovery-stemming bearish divergence in short-term mo to reject/define a more reliable level from which a resumed bearish stance can be objectively based and managed.
MAR GERMAN BUNDS
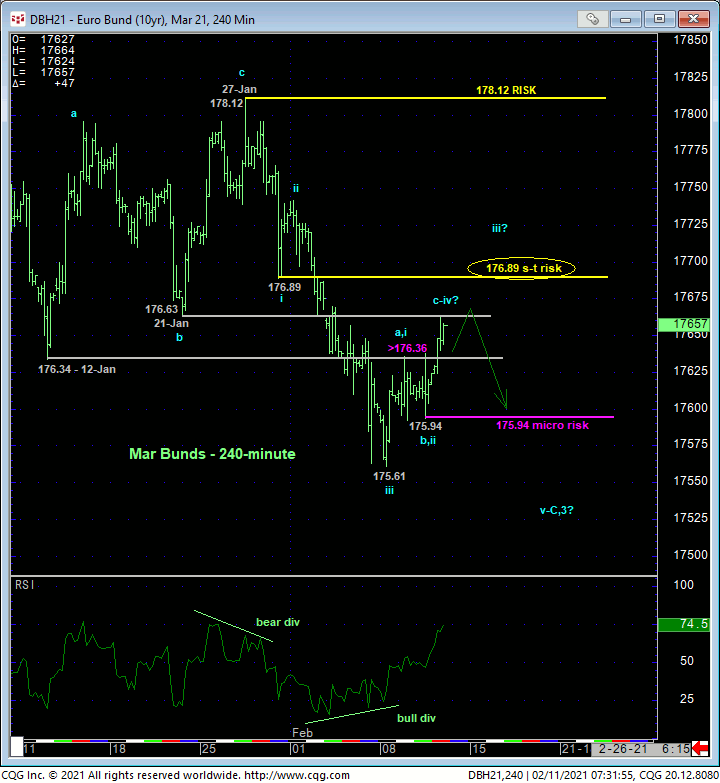
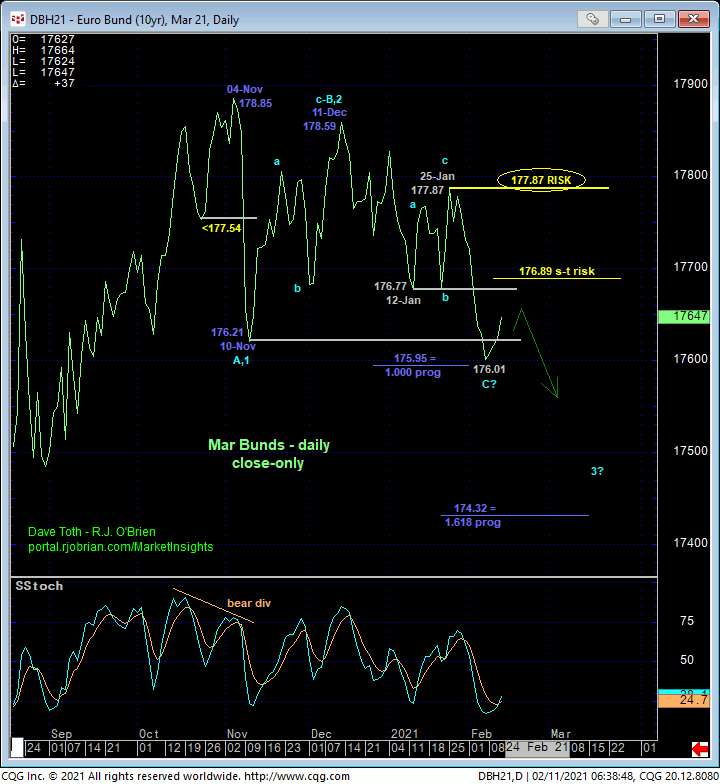
Overnight’s recovery above Tue’s 176.36 initial counter-trend high confirms a bullish divergence in very short-term momentum that confirms at least an interim correction up from Mon’s 175.61 low and leaves yesterday’s 175.94 low in its wake as the latest minor corrective low the market now needs to sustain gains above IF there’s something bigger brewing to the upside. Per such, this 175.94 low serves as a micro risk parameter from which non-bearish decisions can be objectively based and managed by very short-term traders.
As this recovery has thus far only engaged former mid-176-handle-area support-turned-resistance however, t would be premature to conclude that this week’s bounce is anything more than an interim (4th-Wave) correction within the decline from 27-Jan’s 178.12 high. We believe a recovery above at least 29-Jan’s 176.89 (suspected minor 1st-Wave) low remains required to jeopardize the impulsive integrity of the decline from 178.12 and expose a more protracted correction or reversal higher that would warrant defensive steps by shorter-term traders.
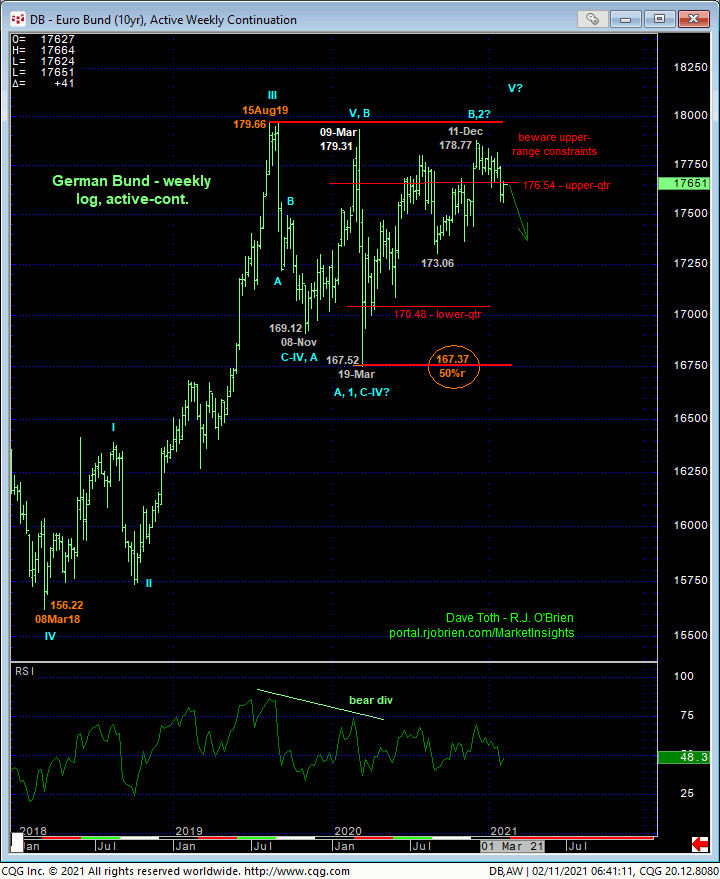
From a longer-term perspective, commensurately larger-degree strength above 25-Jan’s 177.87 larger-degree corrective high remains required to negate our longer-term peak/reversal count, render the sell-off attempt from 04-Nov’s 178.85 high a 3-wave and thus corrective affair and re-expose the secular bull. Until and unless such strength is shown, recovery attempts remain advised to first be approached as corrective selling opportunities by longer-term institutional players.
In sum, a bearish policy and exposure remain advised with a recovery above 176.89 required for shorter-term traders to step aside and commensurately larger-degree strength above 177.87 required for longer-term players to follow suit. Very short-term traders are OK to consider cautious bullish punts from 176.40 OB with a failure below 175.94 required to negate this specific call and warrant its cover ahead of what we’d then believe is a likely resumption of the major bear trend.
