JUN GOLD
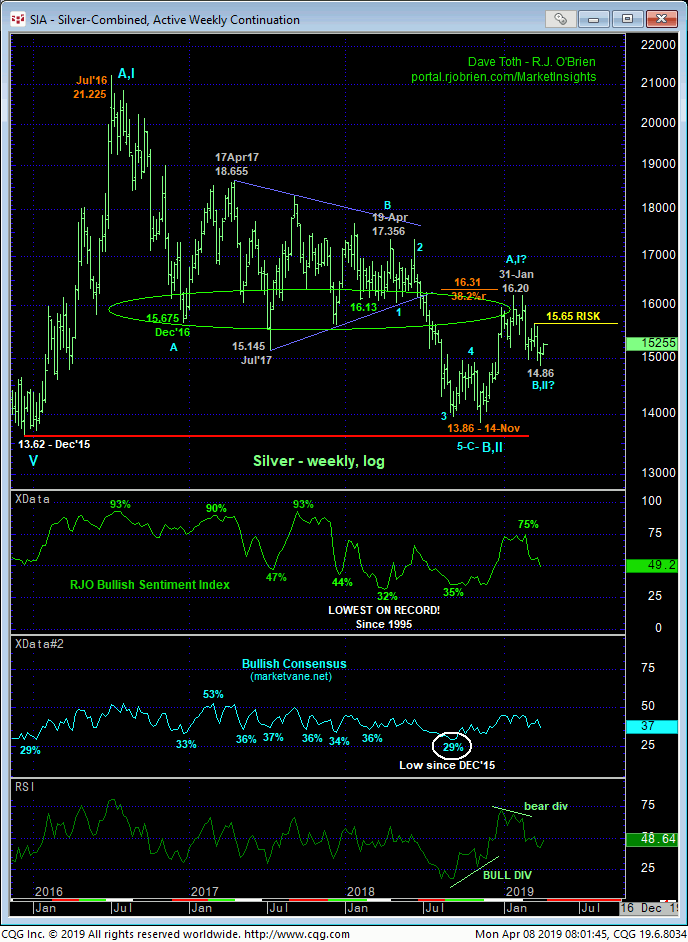
Overnight’s recovery above 03-Apr’s 1299 minor corrective high confirms a bullish divergence in very short-term momentum that defines 04-Apr’s 1284.9 low as the end of the decline from 27-Mar’s 1325.2 high. Stemming from the extreme lower recesses of the past month’s 1281 – 1325-range, this mo failure exposes a rebound to this range’s upper recesses and identifies that 1284.9 low as one of developing importance and our new micro risk parameter from which non-bearish decisions like short-covers and cautious bullish punts can now be objectively based and managed.
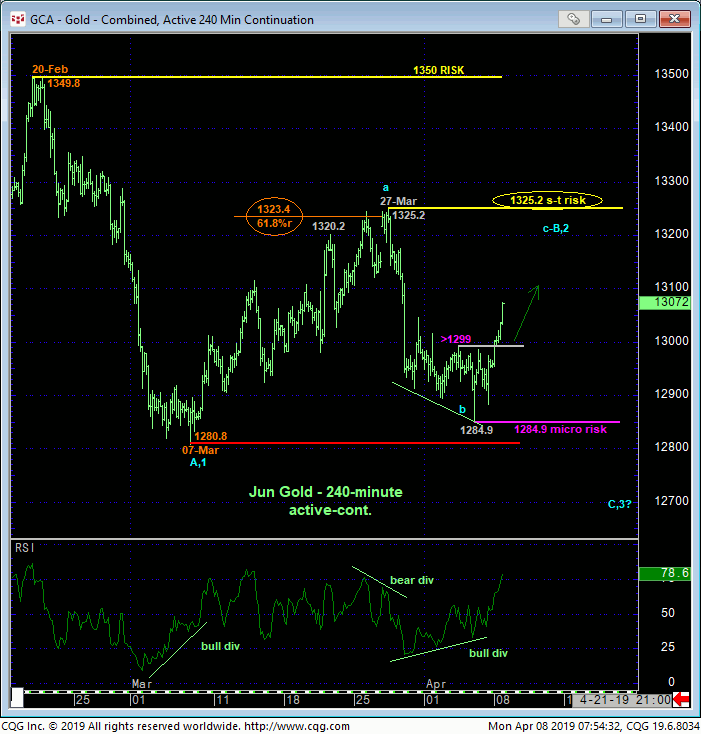
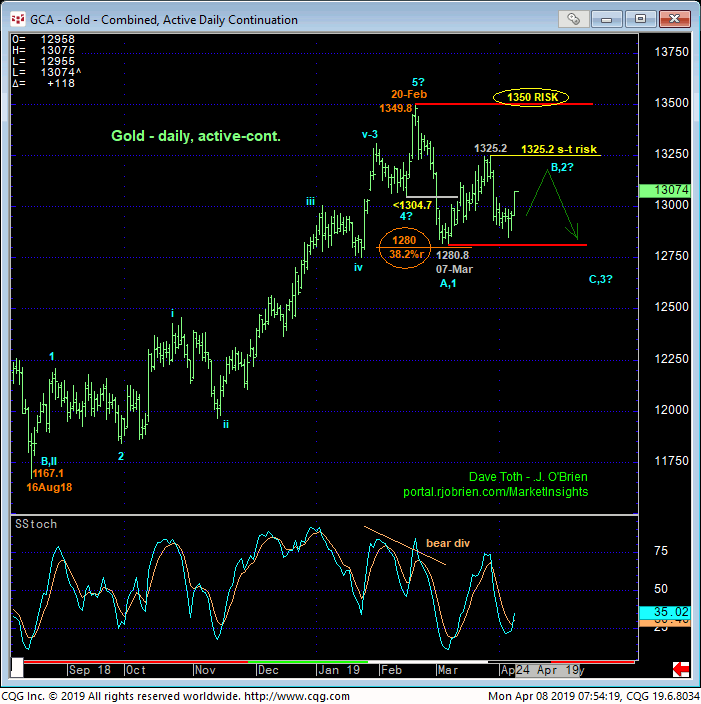
From a longer-term perspective traders are reminded that this market is still dealing with:
- 01-Mar’s confirmed bearish divergence in momentum that broke Aug’18 – Feb’19’s uptrend at
- the extreme upper recesses of the past 3-YEAR range amidst
- a return to relatively frothy bullish sentiment levels and
- an arguably complete 5-wave Elliott sequence from 16Aug18’s 1167.1 low.
These facts and considerations maintain 27-Mar’s 1325.2 high and certainly 20-Feb’s 1349.8 high as key resistance levels and risk parameters the market needs to recoup to lessen the prospects of a broader peak/correction/reversal threat and resurrect a broader bullish one. So this raises once again the important matter of technical and trading SCALE. Today’s bullish divergence in very short-term momentum defines an objective but short-term condition from which non-bearish decisions like short-covers and cautious bullish punts can be objectively based and managed with a failure specifically below 1284.9 required to negate this call, warrant its cover and re-expose the broader peak/reversal threat. From a longer-term perspective however, strength above at least 27-Mar’s 1325.2 high and short-term risk parameter remains required to threaten this peak/reversal count and resurrect a broader bullish one.
MAY SILVER
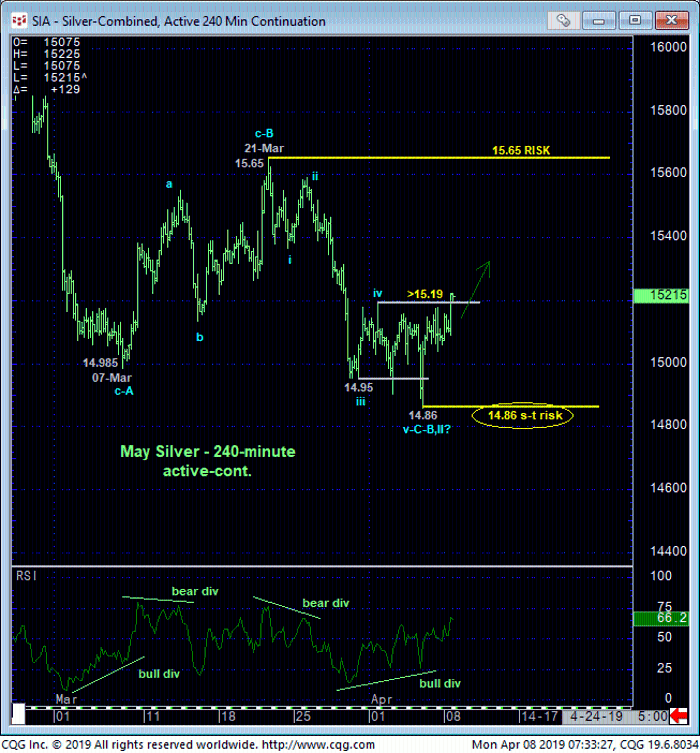
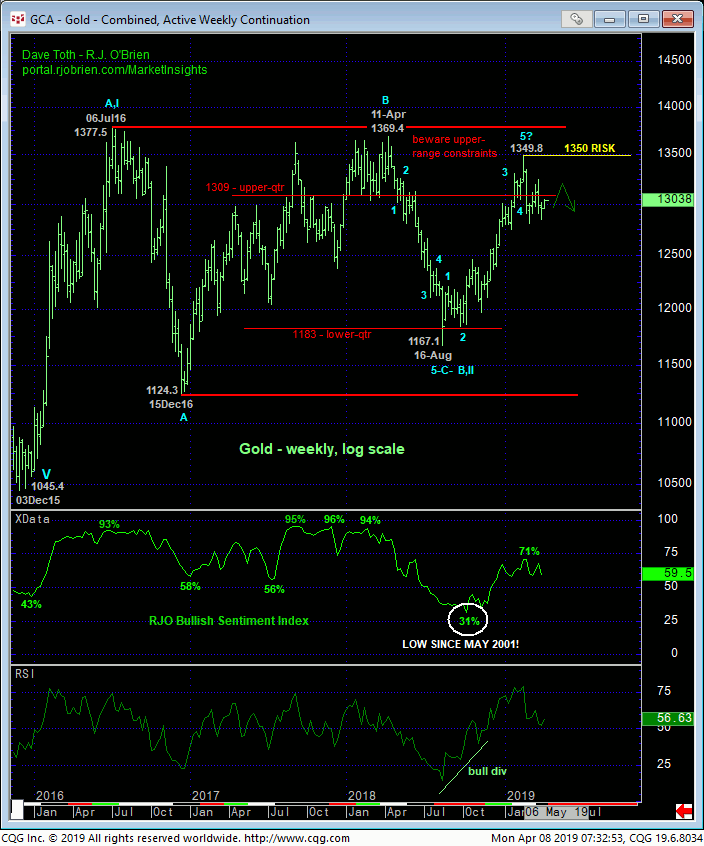
Similarly, overnight’s recovery above 01-Apr’s 15.19 minor corrective high confirms a bullish divergence in short-term momentum that defines Thur’s 14.86 low as the end of the decline from at least 21-Mar’s 15.65 high and exposes at least a correction of this portion of the past month-and-a-half’s decline from 20-Feb’s 16.195 high shown in the daily chart below. But given the 3-wave and thus corrective appearance of the entire Feb-Apr decline, we cannot be certain that last week’s 14.86 low didn’t complete a larger-degree correction ahead of a resumption of Nov-Feb’s uptrend that preceded it. Commensurately larger-degree strength above 21-Mar’s 15,65 larger-degree corrective high and key risk parameter remains required to resurrect such a broader bullish count. Per such we believe the market has identified 15.65 and 14.86 as the key risk parameters and directional triggers heading forward.
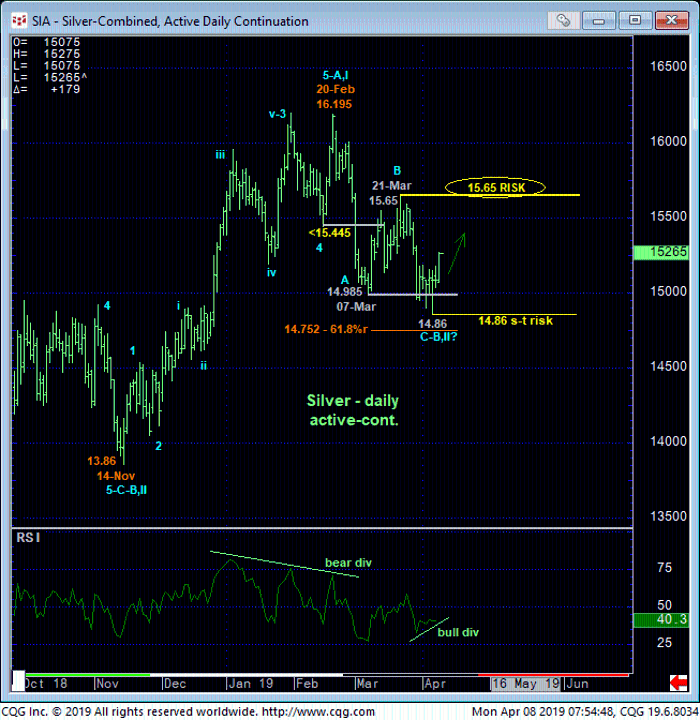
Long-term players are reminded of the market’s Nov/Dec’s rejection of the extreme lower recesses of the 3-YEAR range amidst historically bearish sentiment levels that warn of a base/reversal environment that could be major in scope. The entire-16-handle-area remains intact as a HUGE resistance area and flexion point around which long-term directional biases and exposure can be toggled. A recovery above 21-Mar’s 15.65 high would be a step in that bullish direction, but the bull’s real test remains its ability to break above 31-Jan’s 16.20 high.
These issues considered, shorter-term traders have been advised to neutralize bearish exposure and are further advised to position cautiously from the bull side from 15.18 OB with a failure below 14.86 required to negate this call and warrant its cover. Long-term players are advised to pare bearish exposure to more conservative levels and jettison the position altogether on proof of commensurately larger-degree strength above 15.65.
