JUN 10-Yr T-NOTES
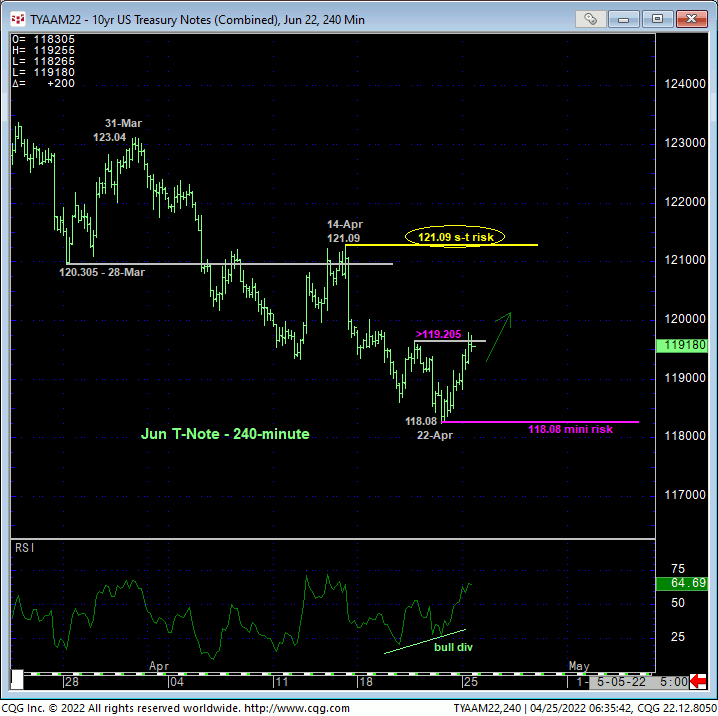
On the smallest of scales, the 240-min chart below shows overnight’s recovery above a minor corrective high at 119.205 from last Wed that confirms a bullish divergence in very short-term momentum. This mo failure defines Fri’s 118.08 low as the end of at least the portion of the secular bear trend from 14-Apr’s 121.09 larger-degree corrective high and a mini risk parameter from which non-bearish decisions like short-covers and cautious bullish punts can be objectively based and managed.
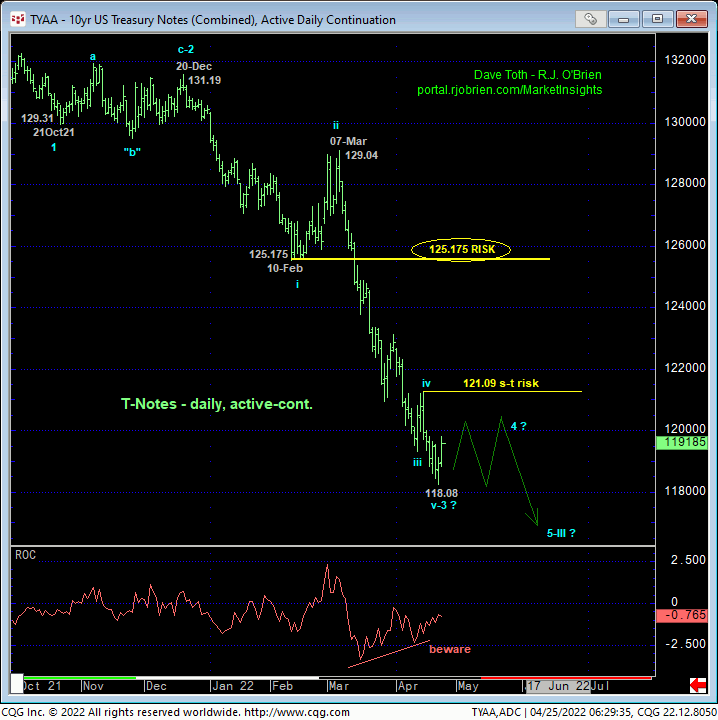
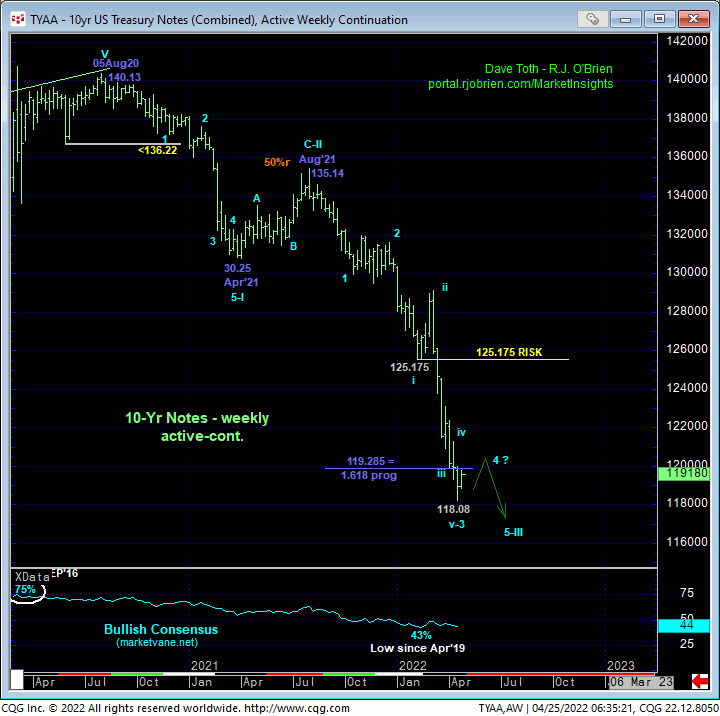
Needless to say, from a longer-term perspective, this piddly bullish divergence in very, very short-term momentum is grossly insufficient to conclude anything more than another corrective burp in the secular bear market shown in the daily chart above and weekly chart below. Commensurately larger-degree strength above at least 14-Apr’s 121.09 corrective high remains required to confirm a bullish divergence in daily momentum sufficient to conclude the end of the portion of the secular bear trend from 07-Mar’s 129.04 high. Per such, this 121.09 level remains intact as our short-term but key risk parameter from which longer-term players can continue to base and manage the risk of a still-advised bearish policy and exposure.
It is interesting to note however the timing of today’s bullish divergence in very short-term momentum. With the gold market totally squandering its early-to-mid-Apr bull run and reverting to the bowels of its 20-month lateral range, a quality-flight to Treasuries is arguable as a result of last week’s swoon in equity prices that we believe could be resurrecting a major peak/reversal process. If equities continue, let alone accelerate their current decline in the days and weeks ahead, there are few alternatives from Treasuries for traders and investors to park funds. And as a result of today’s bullish divergence in admittedly very short-term momentum, the market has identified a specific level- 118.08- from which to objectively base and manage this judgment.
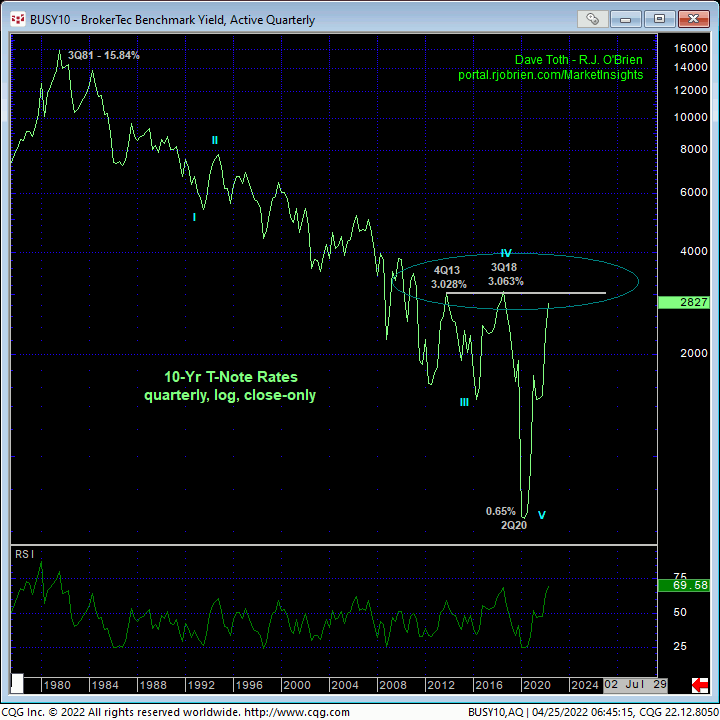
Finally, jumping out to a massive 40-year perspective, the quarterly log close-only chart below shows want we believe is the END of a 39-YEAR decline in rates and start of a reversal higher that, as we’ve expressed since Jan’21, could be generational in scope. This chart also however shows a pivotal hump of resistance around the 3.05%-area that capped bear market corrections between 2013 and 2018. On an intra-quarter basis, this resistance is around 3.25%. We believe the eventual penetration of this 3.05%-to-3.25%-area will be the coup de grace of the massive reversal of 39 years of falling rates and confirmation of a trend higher in rates, the span of which is indeterminable and potentially extreme. UNTIL this area is broken, it would be short-sighted to ignore its relevance as a still-key resistance candidate. And a candidate that might be endorsed by overnight’s bullish divergence in short-term momentum.
These issues considered, it is clear that the market has yet to provide the minimum evidence of strength above at least 14-Apr’s 121.09 corrective high and short-term risk parameter needed to expose a correction higher of sufficient scope for most traders and especially institutional players to pare or neutralize bearish exposure. But for very short-term traders or even longer-term players who acknowledge and accept whipsaw risk- back below 118.08- in exchange for steeper nominal risk above 121.09, non-bearish decisions like short-covers and cautious bullish punts can be objectively based and managed until and unless the market relapses below 118.08.
DEC23 EURODOLLARS
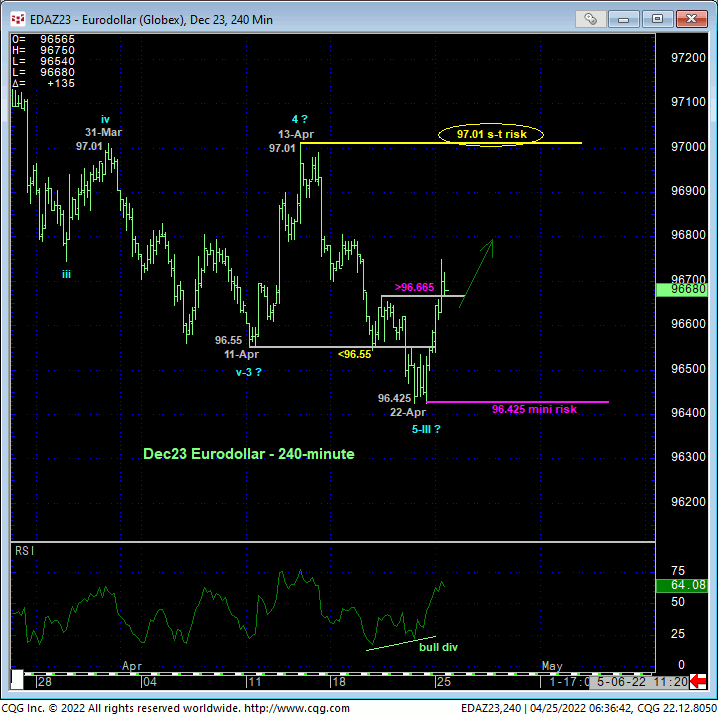
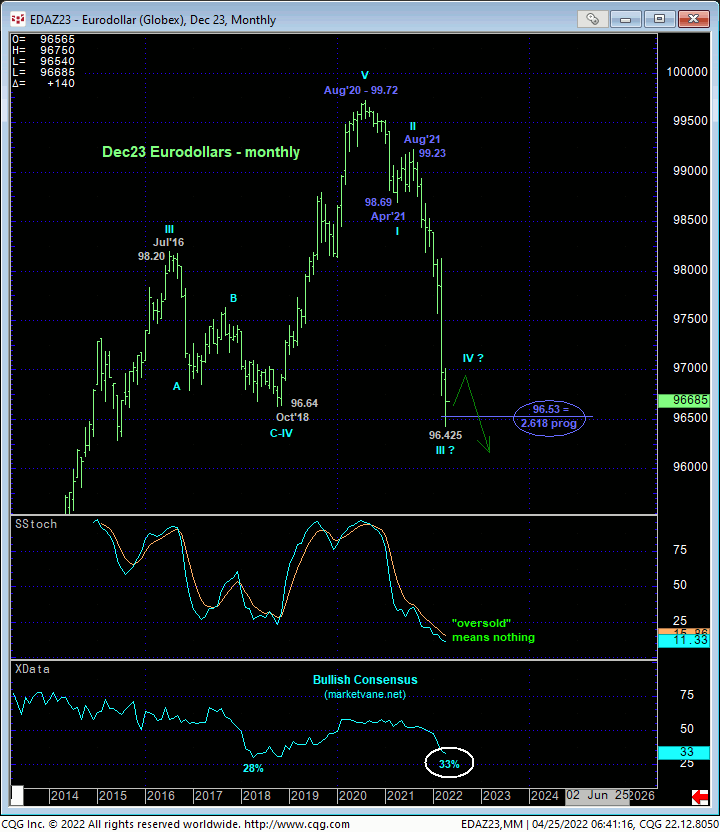
The technical construct and expectations for the Dec23 eurodollar market are identical to those details above in T-notes following overnight’s bullish divergence in very short-term momentum above last Wed’s 96.665 corrective high. This mini mo failure leaves Fri’s 96.425 low in its wake as one of developing importance and a mini risk parameter from which non-bearish decisions like short-covers and cautious bullish punts can be objectively based and managed. From even an intermediate-term perspective let alone a longer-term perspective however, a recovery above at least 13-Apr’s 97.01 corrective and short-term risk parameter remains required to confirm a bullish divergence in DAILY momentum needed to break even the portion of the secular bear trend from 01-Mar’s 98.125 high. Per such, we believe this market has identified 97.01 and 96.425 as the key directional triggers heading forward.
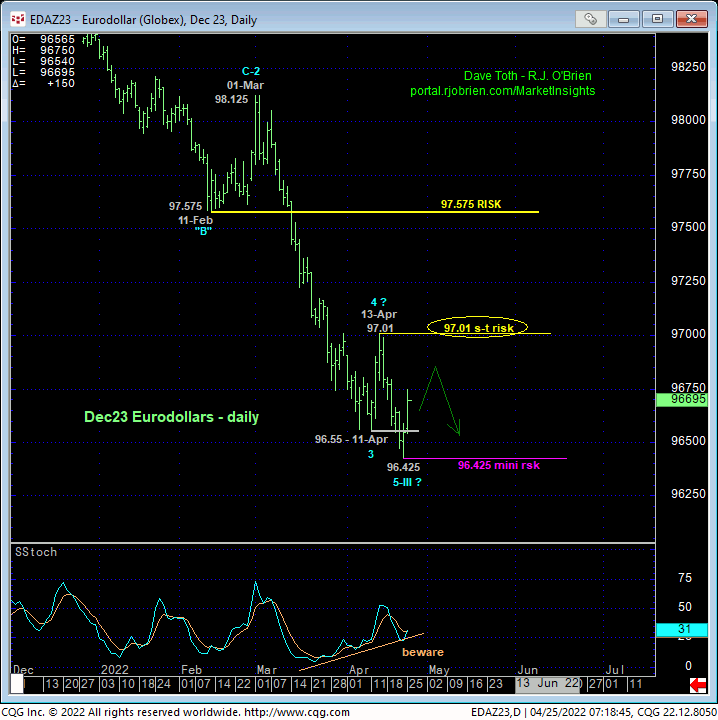
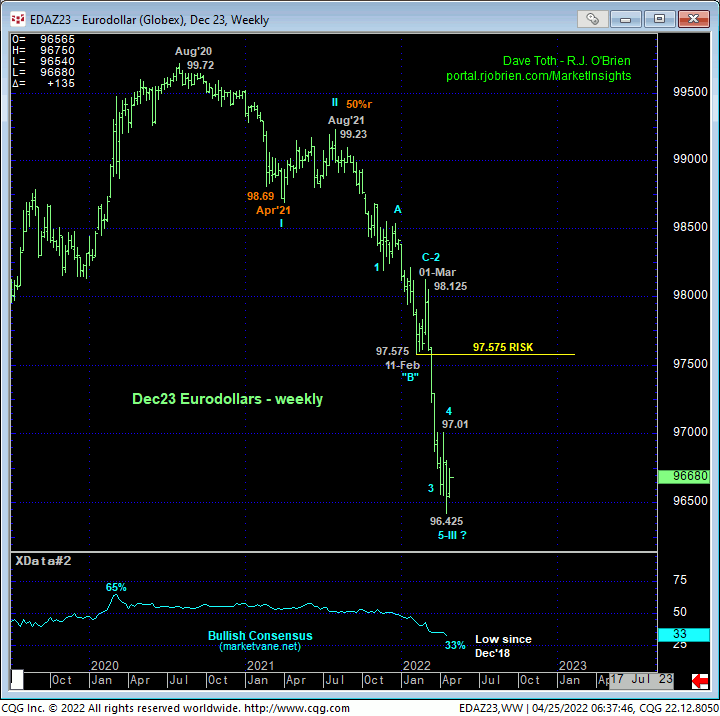
On a broader scale shown in the weekly chart above and monthly chart below, the magnitude of the secular bear market remains clear. A recovery above at least former 97.575-area support-turned-resistance remains minimally required to threaten the major bear market. As this is an impractical distance away even for longer-term institutional players, 13-Apr’s 97.01 corrective high as advised to be used as our key bear risk parameter.
These issues considered, a bearish policy and exposure remain advised for longer-term players with a recovery above 97.01 required to defer or threaten this call enough to warrant paring or neutralizing exposure. Shorter-term traders with tighter risk profiles are advised to pare or neutralize bearish exposure with a relapse below 96.425 negating this call and reinstating the secular bear market that would warrant re-establishing a bearish policy.
