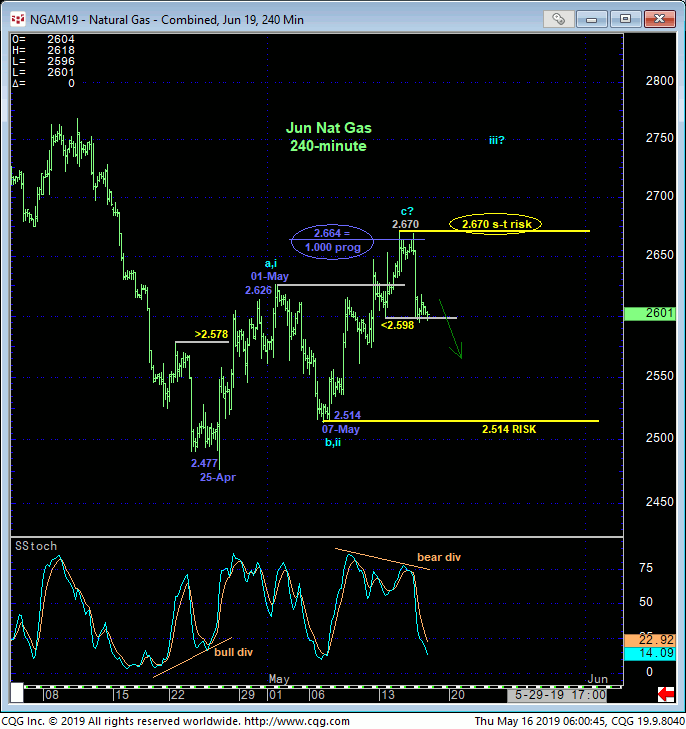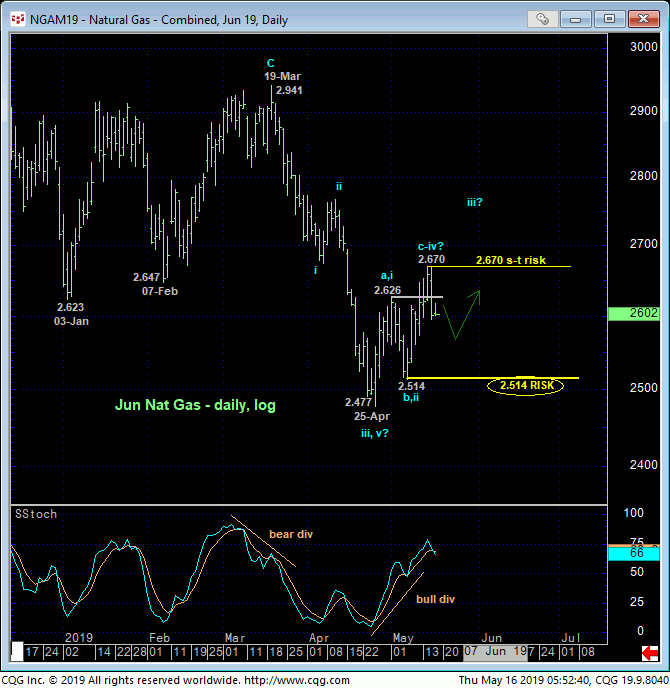
In 26-Apr’s Technical Blog we discussed the prospects for a recovery from the extreme lower recesses of the 3-YEAR range following a bullish divergence in admittedly short-term momentum above 22-Apr’s 2.578 minor corrective high. Three weeks on, yesterday’s failure below Mon’s 2.598 corrective low confirms a countering bearish divergence in equally short-term momentum, stemming the recovery and defining Tue’s 2.670 high as one of developing importance and possibly the END of a textbook 3-wave and thus corrective recovery from 25-Apr’s 2.477 low as labeled in the 240-min chart below. Per such we are identifying this 2.670 high as our new short-term risk parameter from which non-bullish decisions like long-covers and cautious bearish punts can now be objectively based and managed.

To be sure, commensurately larger-degree weakness below 07-May’s 2.514larger-degree corrective low is required to CONFIRM the overall recovery from 25-Apr’s 2.477 low as a 3-wave and thus corrective structure that would then re-expose Mar-Apr’s major downtrend. In this regard that 2.514 low is considered our longer-term risk parameter from which long-term players can rebase and manage the risk of a still-arguable bullish policy. But given that the rally from 07-May’s 2.514 low spanned an almost identical length (i.e. 1.000 progression) to late-Apr’s initial (prospective a-Wave) pop from 2.477 to 2.626, traders must acknowledge the developing bearish prospect that this recent 2.477 – 2.670 recovery is a 3-wave correction that warns of a resumption of Mar-Apr’s meltdown that preceded. In effect, we believe the market has identified 2.670 and 2.514 as the key directional triggers heading forward.


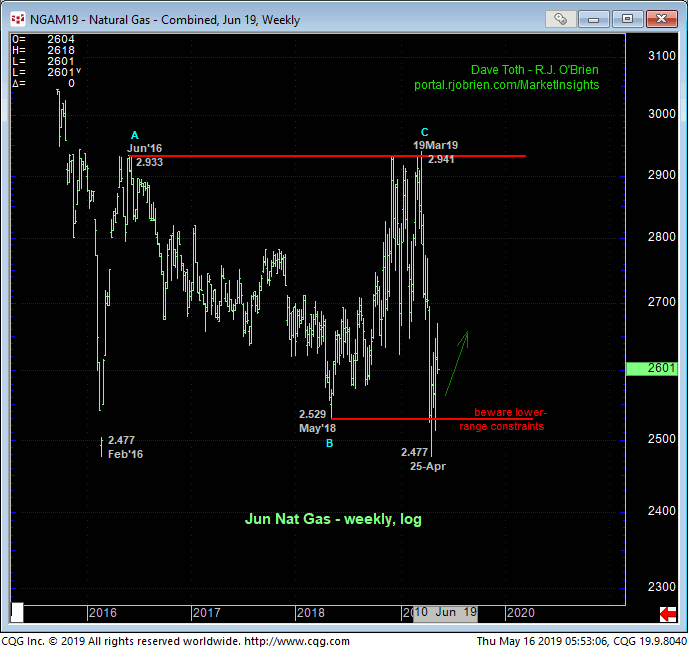
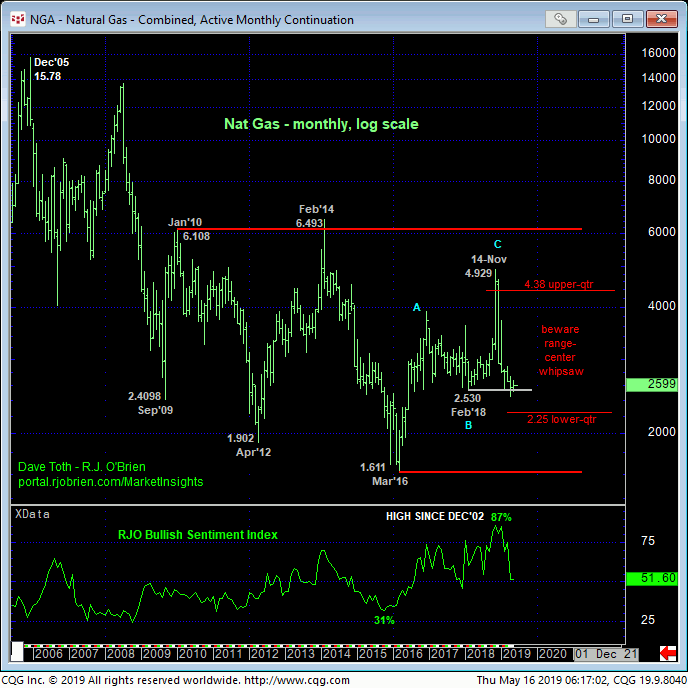
The directional stakes could be high depending on which side of the 2.670-to-2.514-range the market flops over first. While that 2.514 low and support holds, so too does the lower recesses of a 3-year range that could produce another sharp, intra-range rebound like the second-half of 2018 and Feb-Jun’16 shown in the weekly log chart of the Jun contract above. Conversely, if the market fails below 2.514 and resurrects the broader downtrend, we could not ignore the prospect of a run to the lower-quarter of the multi-year lateral range around 2.25 or below on a monthly log active-continuation basis below.
These issues considered, shorter-term traders are advised to move to a neutral-to-cautious-bearish stance from current 2.60-area levels OB with a recovery above 2.670 require to negate this call, reinstate the recovery and expose potentially sharp gains thereafter. Long-term players are advised to pare bullish exposure to more conservative levels and jettison the position altogether on a failure below 2.514 ahead of what could be significant resumption of Mar-Apr’s downtrend that could then expose sharp losses. In effect, traders are advised to toggle directional biases and exposure around the 2.670 – 2.514-range.


