In yesterday’s Technical Blog we identified 27-Ag’s 2.491 low as the corrective low the market needed to sustain gains above to maintain the uptrend from at least 12-Aug’s 2.228 next larger-degree corrective low and key longer-term risk parameter. The 240-min chart below shows the market’s failure to do so, confirming a bearish divergence in short-term momentum that defines Fri’s 2.743 high as one of developing importance and our new short-term risk parameter from which traders can objectively base non-bullish decisions like long-covers and cautious bearish punts.
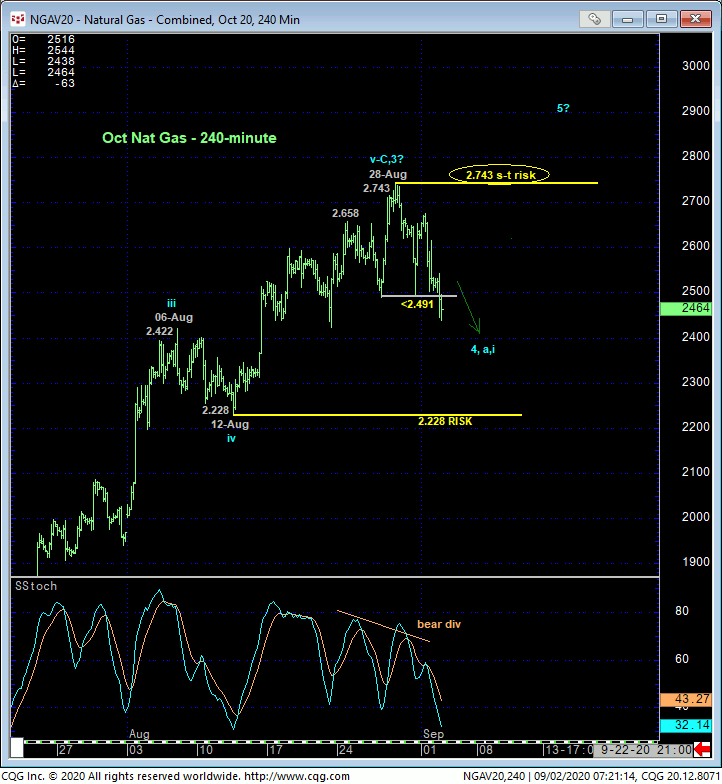
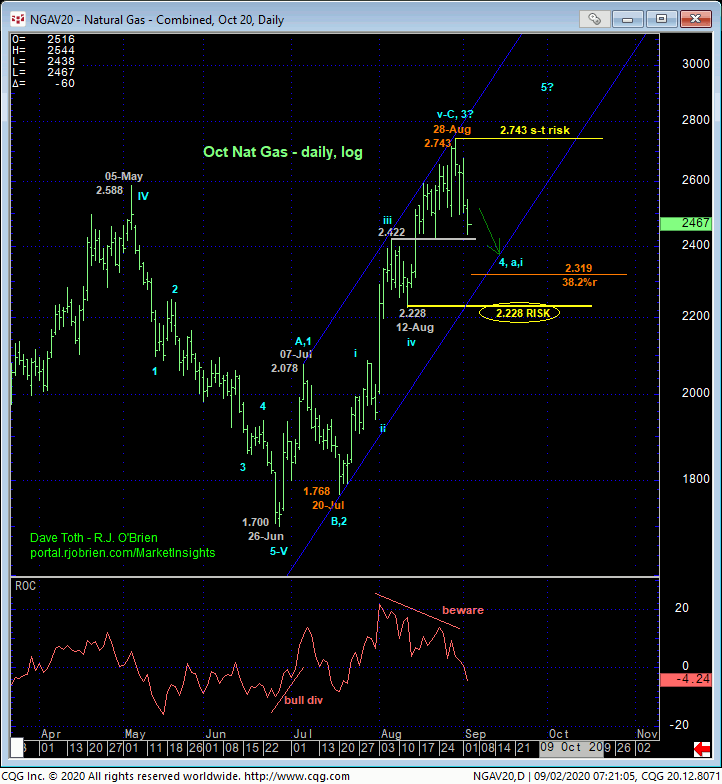
From a longer-term perspective, today’s bearish divergence in short-term momentum clearly is of an insufficient scale to conclude the end of the (C- or 3rd-Wave) rally from 20-Jul’s 1.768 low labeled in the daily log scale chart above. Commensurately larger-degree weakness below at least 12-Aug’s 2.228 next larger-degree corrective low is minimally required to threaten a longer-term base/reversal count.
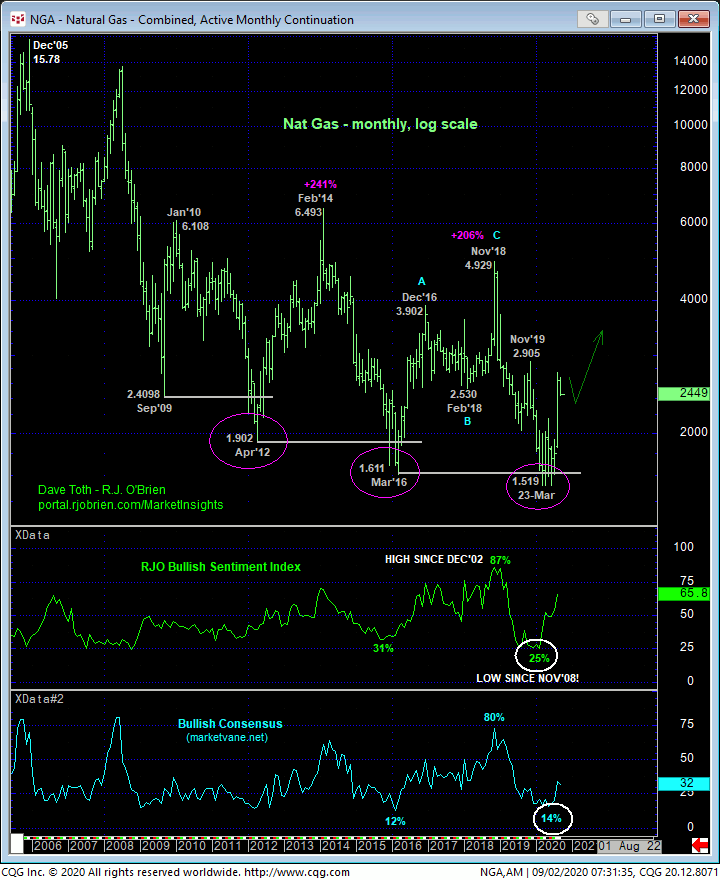
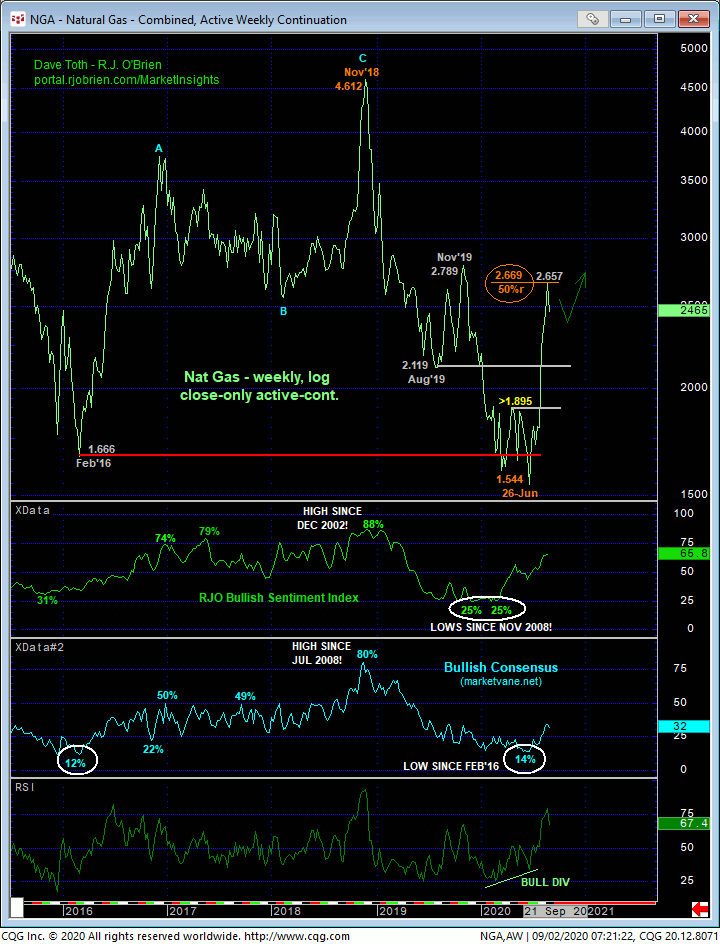
This said and also as discussed yesterday, the weekly log close-only chart below shows Fri’s 2.657 high close being just a smidgen away from the (2.669) 50% retrace of Nov’18 – Jun’20’s entire 4.612 – 1.544 bear trend. This is an interesting technical fact that, combined with even a short-term mo failure, rejects/defines a specific high and resistance from which the depths of an interim correction or broader reversal are indeterminable.
From an even longer-term monthly perspective below and as recently discussed, we believe a MAJOR base/reversal process has begun from 23-Mar’s 1.519 low. And by major, we mean a multi-quarter or even multi-year recovery that, like 2016-18 and 2012-14’s recoveries, could be well over 100% or even 200% to 3.00+ or even 4.00+ levels. Within such a major base/reversal count however, potentially extensive corrective rebuttals lower will not be uncommon. Today’s admittedly short-term momentum failure may or may not be exposing such a (2nd-Wave) corrective relapse. But we know with precision where such a corrective threat is wrong: above 2.743.
These issues considered, shorter-term traders have been advised to move to a neutral/sideline as a result of today’s short-term mo failure below 2.491 to circumvent the depths unknown of a correction lower. Longer-term players are advised to pare bullish exposure to more conservative levels and jettison the position altogether on a failure below 2.228. Needless to say, a recovery above 2.743 stems the correction, reinstates the bull and exposes further and possibly steep gains thereafter that would warrant resurrecting bullish policies.