
NOV SOYBEANS
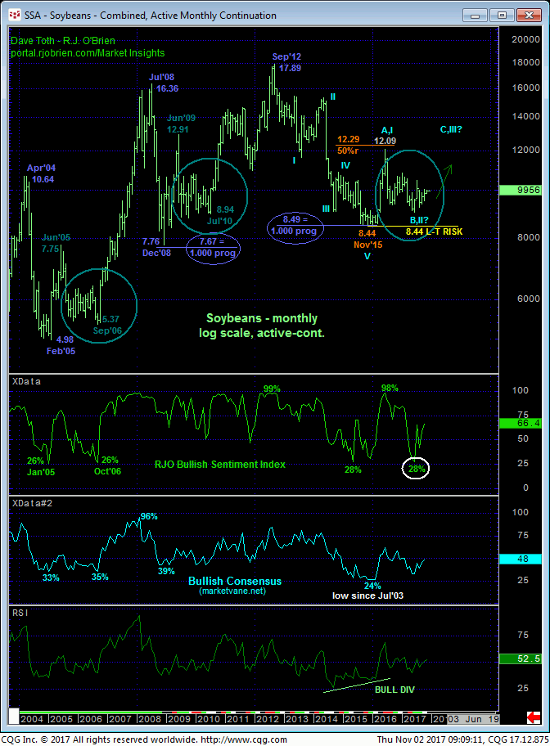
We’d like to begin today’s update by revisiting the technical facts on which our very long-term BASE/REVERSAL threat count is predicated. These facts include:
- Mar/Apr’16’s bullish divergence in MONTHLY momentum that broke the secular bear trend from Sep’12’s 17.89 all-time high amidst
- historically bearish sentiment both around Nov’15’s 8.44 low AND Jun’17’s (suspected) corrective retest of the Nov’15 low
- a complete 5-wave Elliott sequence down from Sep’12’s 17.89 high to Nov’15’s 8.44 low
- the still-fascinating Fibonacci progression fact that the major bear trend from Sep’12’s 17.89 high spanned an identical (i.e. 1.000 progression) to BOTH the 2008 and 2004-05 major declines that preceded it.
This unique and compelling confluence of technical facts identifies Nov’15’s 8.44 low as THE key low and long-term risk parameter the bear has been obligated to break since Mar/Apr’16 to negate this long-term bullish count. Until and unless such sub-8.44 weakness is proven, we believe the price action since Nov’15’s 8.44 is that of a major base/reversal PROCESS similar to those that followed Dec’08’s 7.76 low and Feb’05’s 4.98 low circled in blue in the monthly log active-continuation chart below.
If correct, this count warns of gains above Jun’16’s 12.09 high- and possibly well beyond that high- before a relapse below 8.44 and possibly before a relapse below even 23Jun17’s 9.00 low.
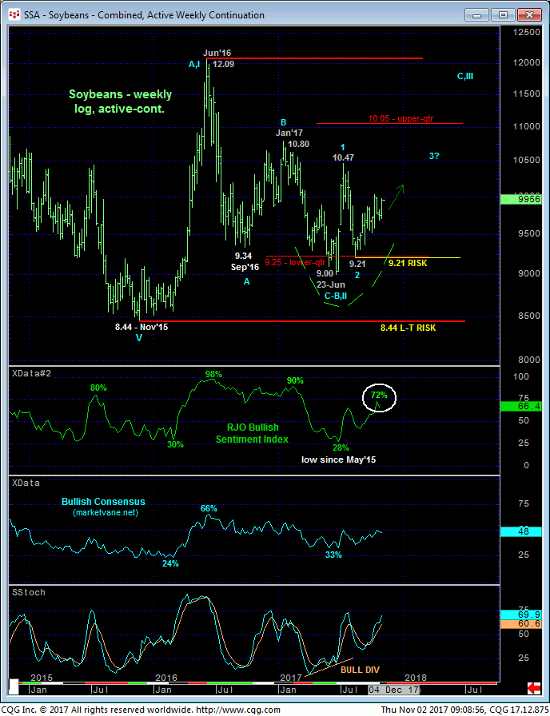
While the weekly log active-continuation chart below shows the market’s current position pretty much smack in the middle of at least the past couple years’ range where aimless whipsaw risk could continue to rule for weeks or even months, this chart also shows the market’s dislike/rejection of the lower-quarter of the multi-year range that we’d EXPECT to see per a broader base/reversal-threat environment.
Market sentiment is neutral-to-somewhat-frothy but far from historic levels that will once again be likely following the type of major reversal we’ve described thus far. The interim trading and research challenge- that could remain in place until 29Mar18’s Prospective Plantings Report- is the market’s position still deep within the middle-half bowels of this incessant 8.44 – 12.09-range. But this challenge, by no means, means that the past 2-1/2-months’ uptrend won’t or can’t continue or even accelerate. Herein lies the importance of identifying pertinent risk parameters around which directional decisions can be objectively based and managed.
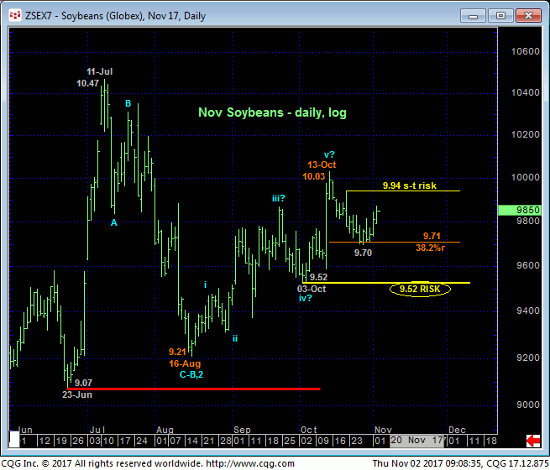
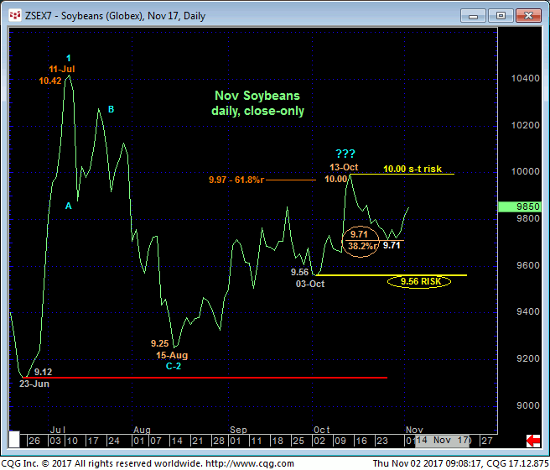
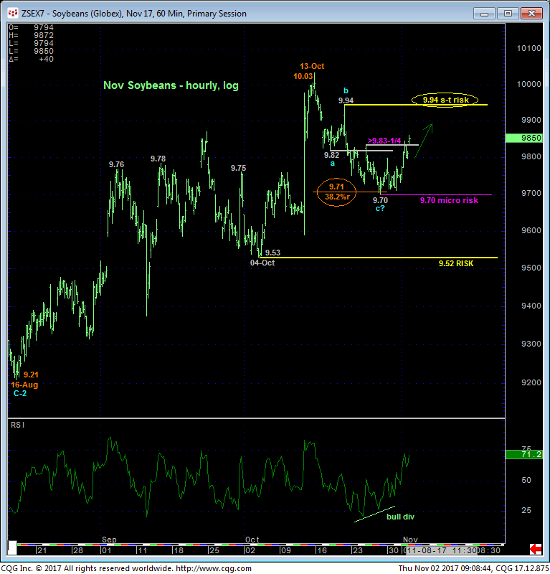
The daily log chart above and daily close-only chart below show the 2-1/2-month uptrend from the mid-Aug lows with the past couple weeks’ sell-off attempt thus far stalling at the Fibonacci minimum 38.2% retrace of this rally. Thus far sustaining gains above 03-Oct’s 9.52 intra-day corrective low (above 9.56 corrective low close), the longer-term uptrend remains arguably intact. This said however, recent smaller-degree highs remain intact as resistance that the market needs to recoup to resurrect at least the uptrend from mid-Aug’s low and possibly the MAJOR reversal from Nov’15’s 8.44 low.
Against this broader bullish backdrop/potential, yesterday morning and today’s recovery above 25-Oct’s 9.83-1/2 minor corrective high confirms a bullish divergence in very short-term momentum that defines 27-Oct’s 9.70 low as one of developing importance and a new micro risk parameter from which non-bearish decisions like short-covers and cautious bullish punts can be objectively based and managed. T be sure, recent highs at 9.94 and 10.03 remain intact as resistance levels this market needs to clear to increase the odds that the recent 10.03 – 9.70 decline is a complete 3-wave and thus corrective affair ahead of a resumption of a broader developing uptrend. While these highs/resistance remain intact, so too does the prospect for further lateral-to-lower prices and consolidation.
These issues considered, long-term players/end-users remain advised to maintain a bullish policy and exposure with weakness below 9.52 required to pare this exposure to more conservative levels and subsequent weakness below 9.21 to liquidate altogether. Shorter-term traders with tighter risk profiles are OK to play both sides of the fence with cautious bearish exposure threatened enough above 9.94 to warrant its cover and a failure below 9.70 required to negate a specific bullish count. Ultimately however, and until or unless threatened by a break below at least 9.52, we believe further and possibly surprising gains should, well, not surprise.
DEC SOYBEAN MEAL
Meal isn’t likely to go anywhere that beans aren’t and it’s not hard to see virtually an identical technical construct on every scale to that detailed above. The hourly chart below shows the developing potential for a bullish divergence in momentum, but proof of strength above 25-Oct’s 317.8 corrective high and new short-term risk parameter is required to CONFIRM the divergence to the point of non-bearish action like short-covers and a resumed bullish policy.
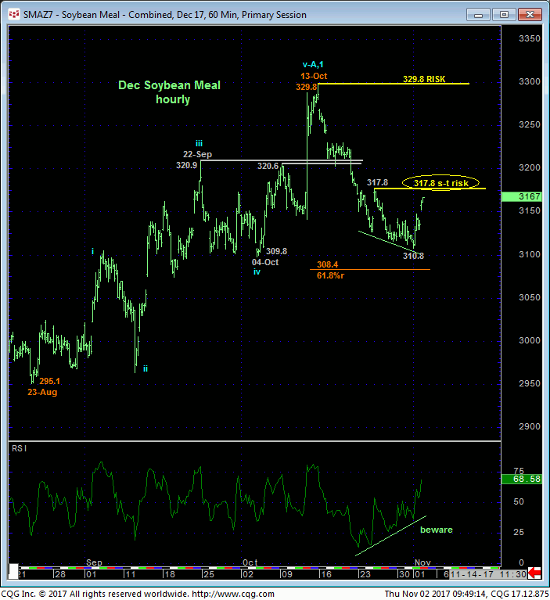
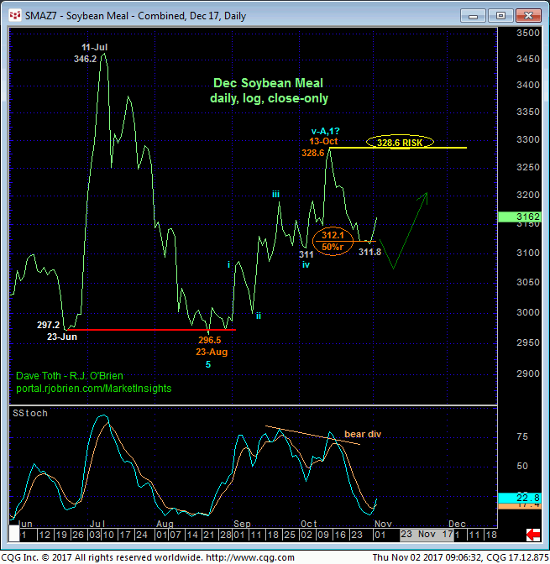
The extent of the past couple weeks’ setback is enough to identify 13-Oct’s 328.6 high close as the end of a 5-wave Elliott sequence up from 23-Aug’s 296.5 low. While that 328.6 high and key risk parameter remains intact as a resistant cap, further lateral-to-lower prices should not surprise. This said however, and especially if the market can confirm a short-term bullish divergence above 317.8, the fact that the recent sell-off attempt has stalled around the Fibonacci minimum (312.1) 38.2% retrace of the 296 – 328 rally would seem to reinforce a count calling yesterday’s 311.8 low close (310.8 intra-day low) the end or lower boundary of a corrective/consolidative event that warns of an eventual resumption of Aug-Oct’s uptrend that preceded it.
From a long-term perspective the weekly log active-continuation chart below shows the similar base/reversal-threat factors of the market’s rejection of the lower-quarter of the past few years’ range amidst what were historically bearish sentiment levels while doing so. A recovery above 13-Oct’s 329.8 high and key risk parameter will reinforce this bullish count and expose potentially steep gains thereafter while a failure below 23-Aug’s 295.1 key low and long-term risk parameter remains minimally required to threaten this long-term base/reversal count that ultimately warns of a run at Jun’16’s 432 high before breaking Feb’16’s 258 low.
In sum, a neutral-to-cautiously-bearish policy remains OK with a recovery above 317.8 negating this call and tipping the directional scales back to the bull side with subsequent weakness below yesterday’s 310.8 low required to negate that call.


