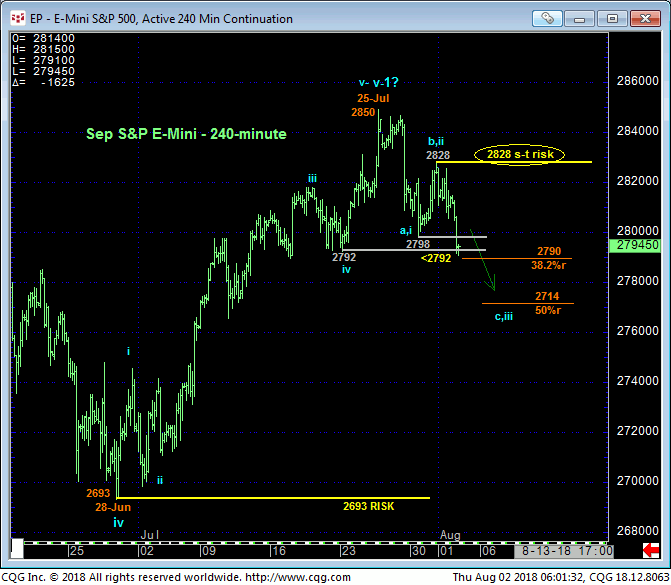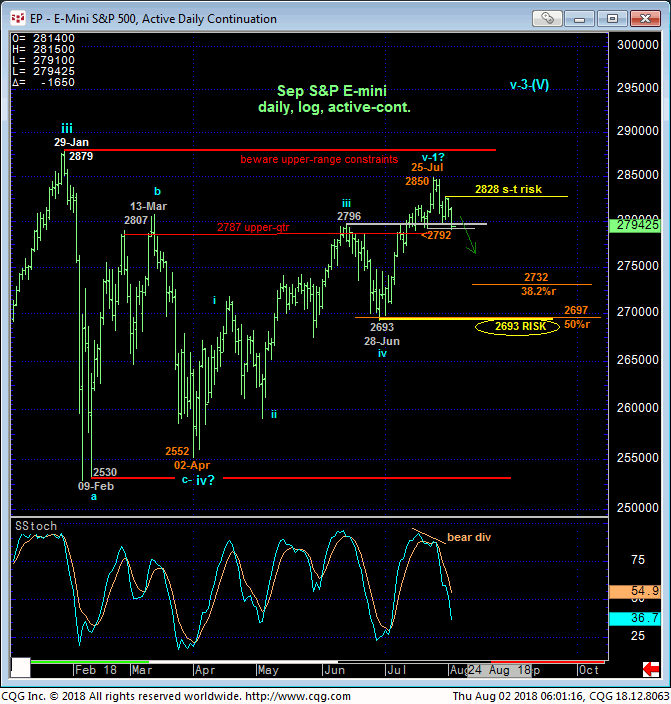
The market’s failure this morning below our short-term risk parameter defined by 23-Jul’s 2792 corrective low confirms a bearish divergence in momentum that defines 25-Jul’s 2850 high as the END of a textbook 5-wave Elliott sequence from 28-Jun’s 2693 low as labeled in the 240-min chart below. And while that 2850 high is one of obvious developing importance, this morning’s break below Mon’s 2798 initial counter-trend low leaves Tue’s 2828 high in its wake as the latest smaller-degree corrective high and new short-term risk parameter from which non-bullish decisions like long-covers and cautious bearish punts can be objectively based and managed.


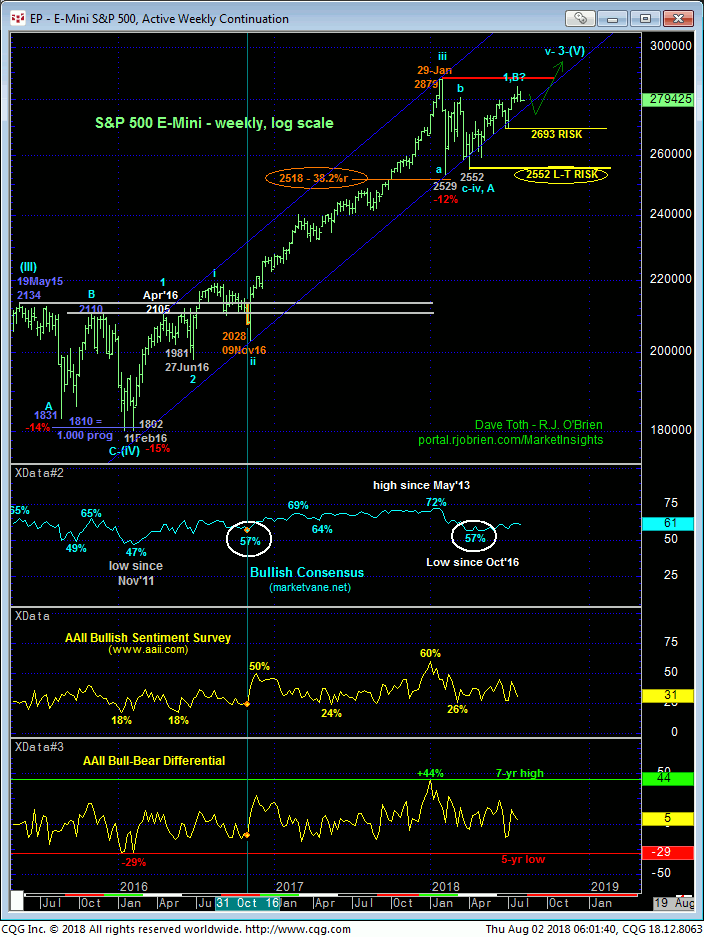
The fact that this admittedly short-term mo failure stems from the extreme upper recesses of this YEAR’S entire range shown in both the daily log chart above and weekly log chart below cannot be ignored as a combination that could expose a more protracted, if intra-2018-range setback. Additionally, the prospect exists that the rally from 28-Jun’s 2693 low to last week’s 2850 high is the completing 5th-Wave of a larger-degree sequence up from 02-Apr’s 2552 low labeled in the daily chart above. If correct, even a Fib minimum 38.2% retrace of this 2552 – 2850 rally doesn’t cut across until the 2732-area while its 50% retrace would neighbor 28-Jun’s 2693 larger-degree corrective low and our key long-term risk parameter.
From an even longer-term perspective however, a break below 02-Apr’s 2552 major corrective low remains MINIMALLY required to even defer, let alone threaten the secular bull market. So for longer-term players, such a relatively larger-degree yet intra-2018-range correction in the weeks ahead offer a favorable risk/reward opportunity to take some profits off the table on a portion of one’s position and reduce some risk and look to re-establish those longs following a bullish divergence in momentum needed to stem this expected relapse and re-expose the secular bull. The scale issue currently is that the scope of this suspected correction is indeterminable. But this morning’s short-term mo failure below 2792 provides and acute and favorable risk/reward opportunity to play this correction as long as the market stays below 2828.
These issues considered, shorter-term traders have been advised to neutralize bullish exposure and are further advised to establish cautious bearish exposure at-the-market (2795) with a recovery above 2828 required to negate this call and warrant its cover. Longer-term players are advised to pare bullish exposure to more conservative levels and reverse this call on a recovery above 2828. In lieu of such 2828+ strength we anticipate further and possibly relatively significant losses within this year’s broader range in what could be many weeks ahead.


