MAR E-MINI S&Ps
While of the smallest of scales, overnight’s slip below 21-FDeb’s 2764 corrective low, a recent area of former resistance-turned-support and our short-term risk parameter confirms a bearish divergence in momentum. This admittedly short-term mo failure defines Mon’s 2820 high as one of developing importance and our new short-term risk parameter from which shorter-term traders with tighter risk profiles can objectively base non-bullish decisions like long-covers and cautious bearish punts.
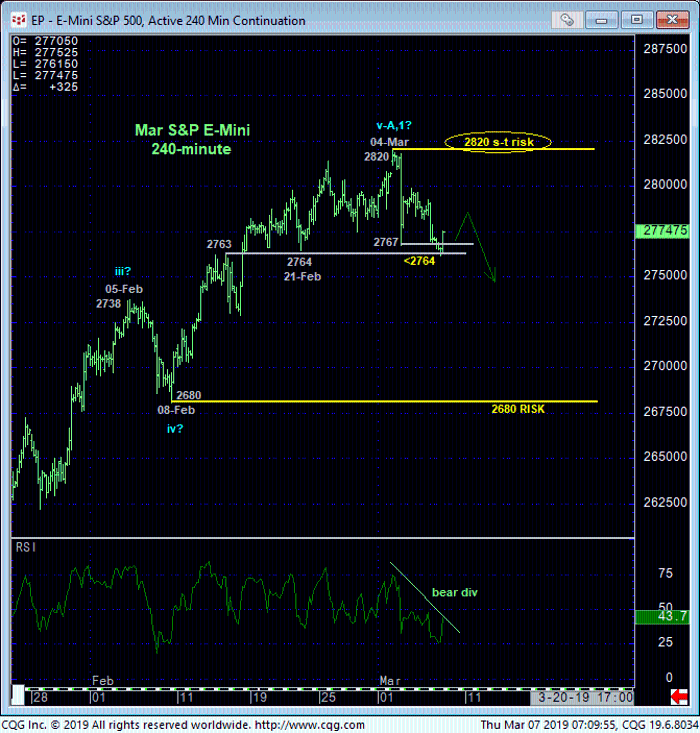
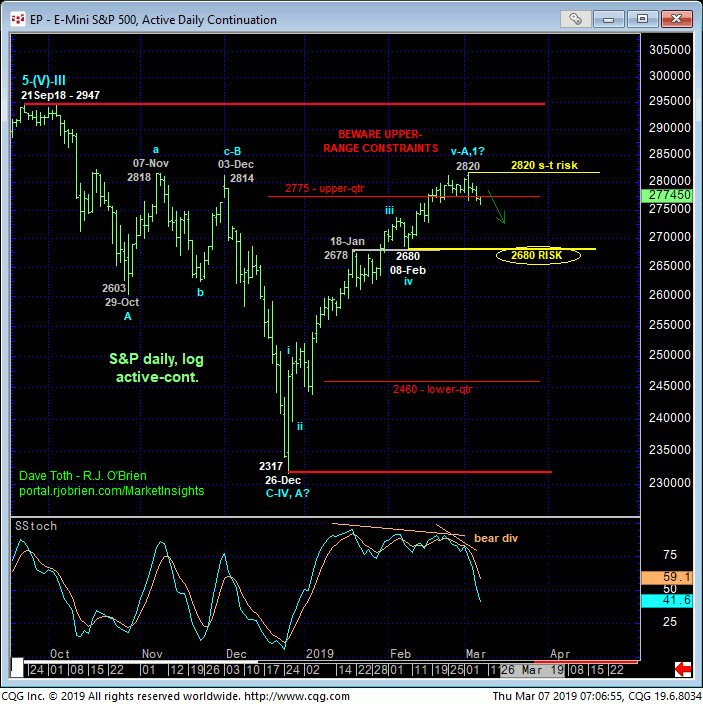
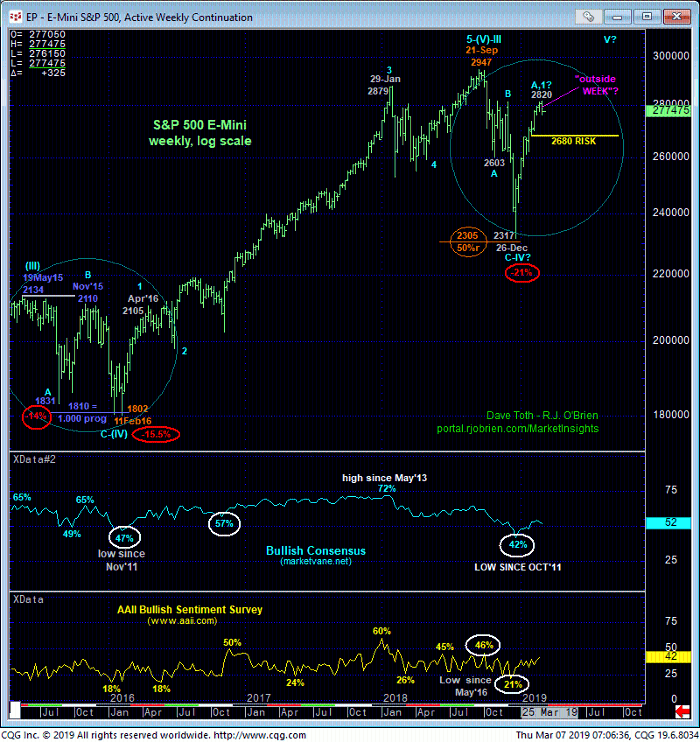
While this bearish divergence in momentum is of a grossly insufficient SCALE to conclude anything more a this juncture than another interim corrective hiccup within the past 10 weeks’ impressive, impulsive rally, that fact that it’s stemming from the upper-quarter of the past 5-1/2-month range s disconcerting. The prospect that Mon’s 2820 high completed a 5-wave Elliott sequence as labeled above is also a threat to bulls as is the growing prospect for an “outside WEEK down” this week shown below.
Additionally and as discussed below, the extent of the past few days’ 10-yr T-note rebound warns that the past couple months’ sell-off attempt is merely corrective ahead of a resumption of Oct-Jan’s major uptrend. Given the relative inverse correlation between equities and Treasuries, this rebound would seem to reinforce a peak/correction/reversal threat in equities.
From a very long-term perspective and since 21Sep18’s obviously pivotal 2947 al-time high remains intact, traders and investors remained warned about the prospect that Sep-Dec’18’s meltdown may only be the first part of a major correction/consolidation that has much further to go in terms of at least TIME and perhaps PRICE as well. To this point the price action from last Sep’s 2947 high is NO DIFFERENT than that that stemmed from May’15’s 2134 high circled in blue below. In that previous major correction/consolidation the market endured an even greater retrace of May-Aug’15’s 2134 – 1831 decline before melting down once again in a 3-month collapse that broke the initial 1831 low and ended up completing what became a 15.5% correction before the secular bull resumed.
We’re certainly not forecasting another 3-month meltdown to even the lower-quarter (2460) of the 5-month range from just a minor mo failure below 2764. Indeed, a commensurately larger-degree momentum failure below 08-Feb’s 2680 next larger-degree corrective low and key risk parameter remains required to break the 10-week uptrend and raise the odds of a more protracted decline. But until and unless this market can recoup Mon’s 2820 high, traders should be alert to the developing threats to the S&P bull and manage risk according to their personal risk profiles.
These issues considered, shorter-term traders have been advised to move to a neutral/sideline position as a result of overnight’s failure below 2764. Furthermore, a cautious bearish punt from 2790 OB is advised with a recovery above 2820 negating this call and warranting its cover and return to a bullish policy. Long-term players remain OK to maintain a bullish policy with a failure below overnight’s 2761 low required to pare bullish exposure to more conservative levels and subsequent weakness below 2680 to jettison the position altogether ahead of what could be protracted losses thereafter.
JUN 10-Yr T-NOTES
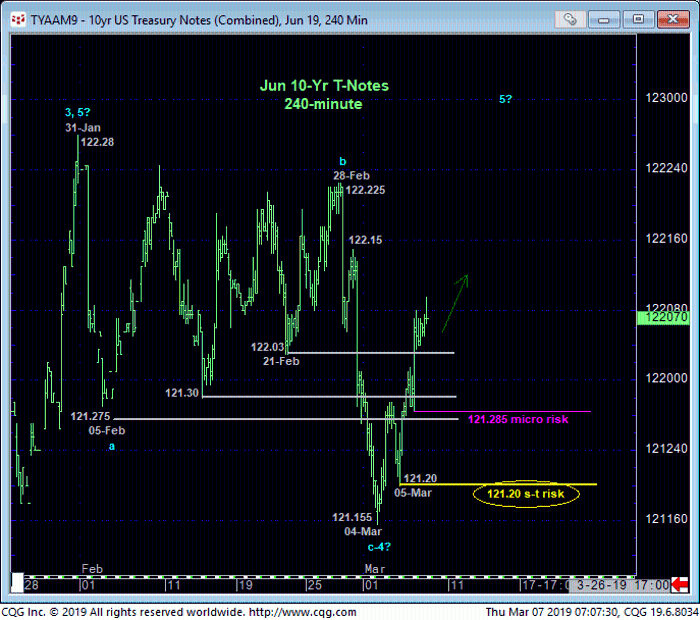
The market’s gross failure to sustain last Fri’s breakdown below a relative ton of former support-turned-resistance from the 122.03-to-121.27-range renders Feb’s sell-off attempt from 122.28 to 121.155 a 3-wave affair as labeled in the 240-min chart below. Left unaltered by a relapse below at least yesterday’s 121.285 micro corrective low and preferably Tue’s 121.20 corrective low, this 3-wave decline is considered a corrective/consolidative one that warns of a resumption of the second-half of Jan’s uptrend that preceded it.
Further, these past few days’ intra-range rebound contributes to an even larger-degree (4th-Wave) consolidation range from 03-Jan’s 123.055 high that swings the directional scales back to the bull side and a (5th-Wave) resumption of the major uptrend from last Oct’s 117.135 low to new highs above 123.06. Given the generally inverse correlation between Treasuries and equities, odds are that T-notes aren’t going to rally to that degree without stocks taking a hit.
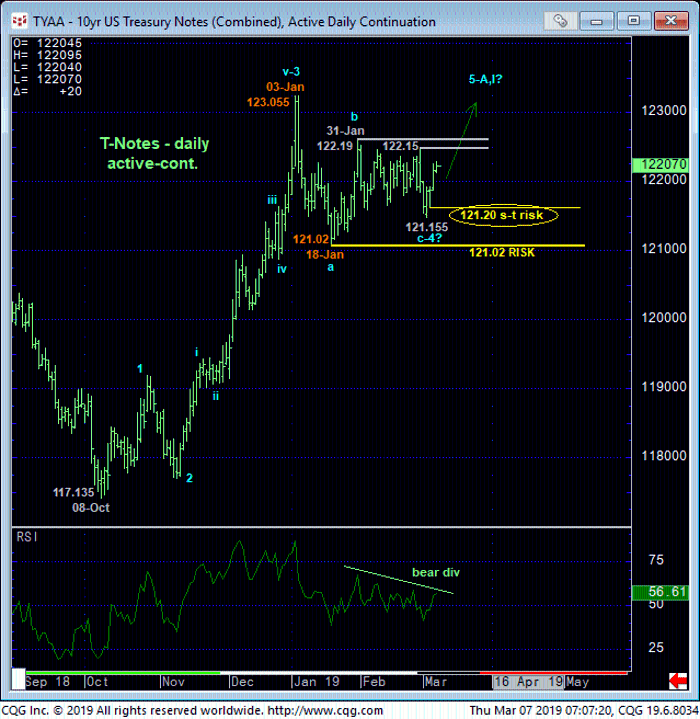
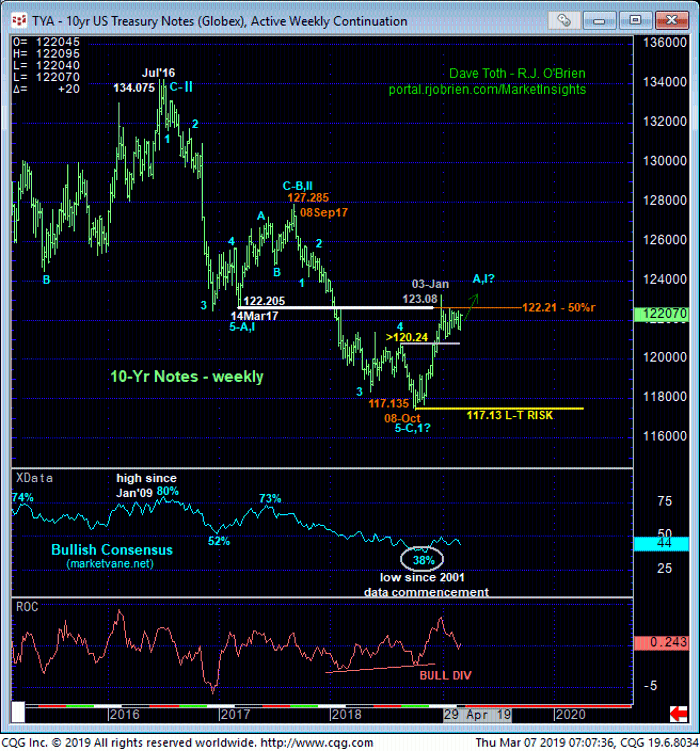
From an even longer-term perspective shown in the weekly chart below, we maintain our stance about the 122-handle-area being a key resistance candidate. But if 03-Jan’s 123.055 high completed the rally, then somewhere along the line this market has got to start breaking AND SUSTAINING losses below levels like 121.20, 04-Mar’s 121.155 low and 18-Jan’s 121.02 low and new key long-term risk parameter. In lieu of such weakness trader are advised to use these levels as our new short- and longer-term risk parameters to a resumed bullish policy from current 122.13-area prices OB.
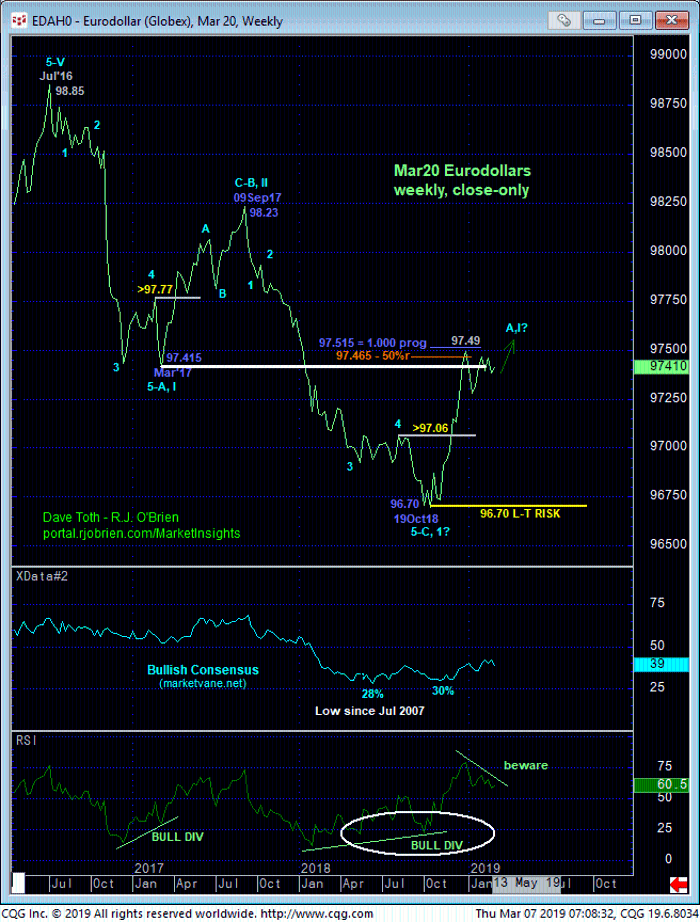
MAR20 EURODOLLARS
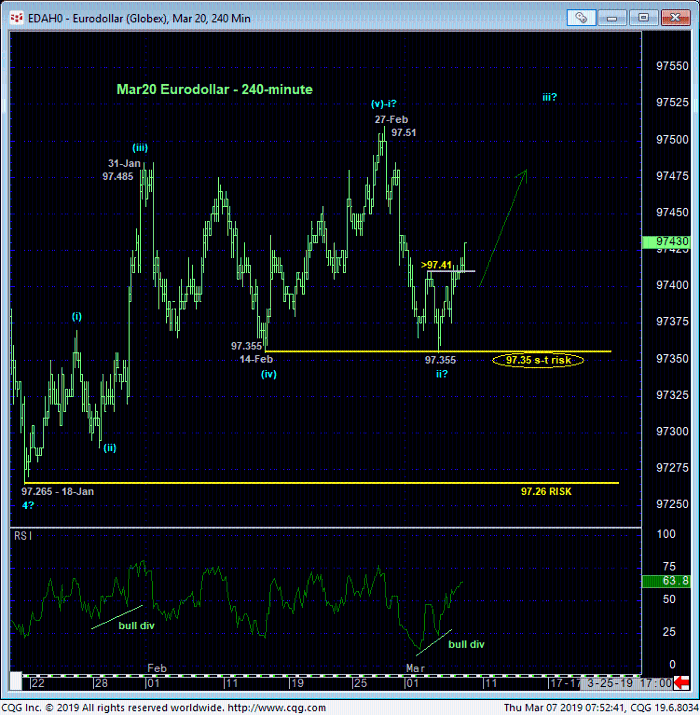
Eurodollars aren’t going anywhere that Treasuries aren’t, so a bullish count in 10-yrs is likely to be met with similar technicals in Eurodollars. And yesterday/todays recovery above Mon’s 97.41 corrective high confirms a bullish divergence in momentum that leaves Tue’s 97.355 low in its wake as the end of the decline from 27-Feb’s 97.51 high and possibly the end of the correction of Jan-Feb’s 97.265 – 97.51 rally. Given the labored, 3-wave appearance of the broader sell-off attempt from 03-Jan’s 97.635 high, a resumption of Oct-Jan’s major rally that preceded this action should not surprise, with a failure below a least 97.35 required to threaten this count.
This presents a favorable risk/reward opportunity from the bull side from current 97.42-area prices with a protective sell-stop below 97.35 targeting new highs above at least 97.51 and possibly above 97.64.

From a long-term perspective, the 97.41-to-97.51-area we identified as resistance back in Dec remains intact. But if a broader peak/reversal threat s at hand because of this, then somewhere along the line this market has to start breaking and sustaining levels below at least 97.35 and preferably 18-Jan’s 97.26 low and key risk parameter. These issues considered, traders are advised to move back to a bullish policy and exposure from current 97.,42-area levels OB with a failure below 997.,35 required to negate this specific call and warrant its cover. In lieu of such sub-97.35 weakness, further and possibly accelerated gains are expected.
