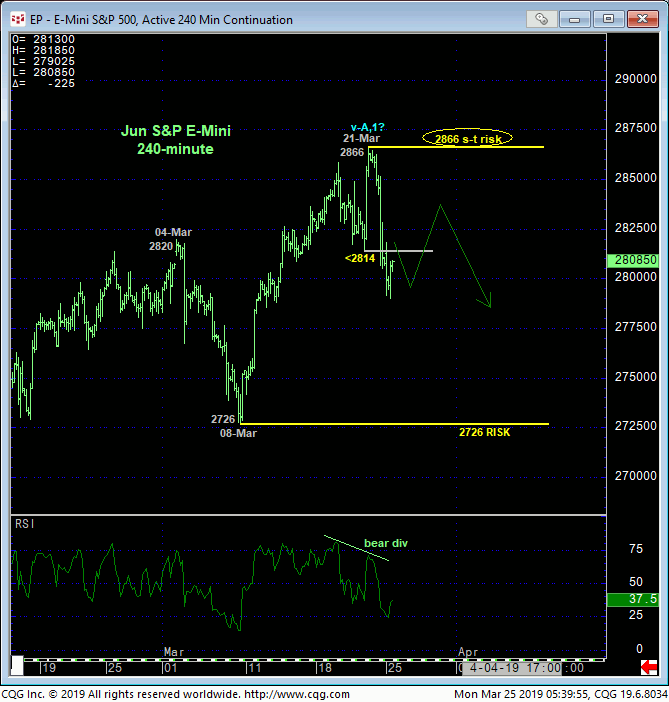
JUN E-MINI S&Ps
The market’s failure Fri below Thur’s 2814 minor corrective low confirms a bearish divergence in momentum. In and of itself this is clearly only a smaller-degree momentum failure that only allows us to conclude Thur’s 2866 high as the END of the uptrend from 08-Mar’s 2726 low. And in this vein that 2866 high serves as a tight but objective short-term risk parameter from which shorter-term traders with tighter risk profiles can base non-bullish decisions like long-covers and cautious bearish punts.
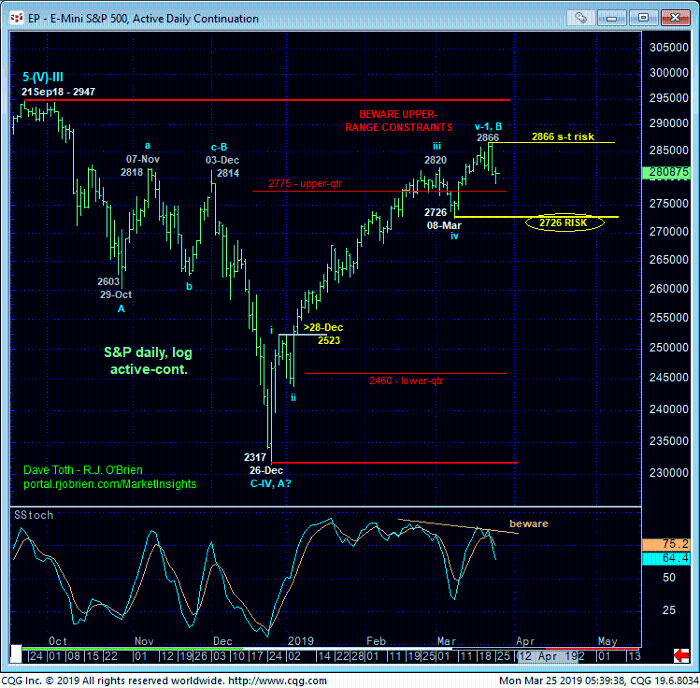
From a longer-term perspective, commensurately larger-degree weakness below 08-Mar’s 2726 next larger-degree corrective low and key risk parameter remains required to, in fact, confirm a bearish divergence in momentum of a SCALE SUFFICIENT to break the broader uptrend from 26Dec18’s 2317 low shown in the daily log chart below. HOWEVER:
- waning upside momentum on this broader scale
- the prospect that this month’s rally is the completing 5th-Wave of an Elliott sequence from the Dec low and
- the market’s position at the extreme upper recesses of the 6-MONTH range
contribute to a slippery slope for bulls “up here”. IF there’s a time and place to keep a keener eye on a peak/reversal threat, it is here and now with the next step of that threat evidenced by a larger-degree momentum failure below 2726, our key risk parameter. To diffuse this threat, at least for the time being, all the market needs to do is recoup 2866. In effect, we believe the market has identified 2866 and 2726 as the key directional triggers heading forward.
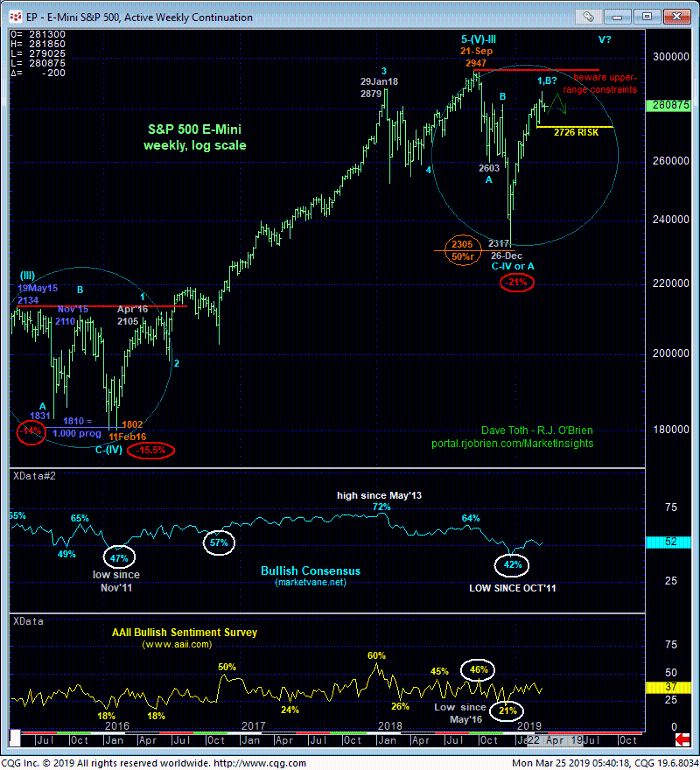
Indeed, while 21Sep18’s 2947 al-time high remains intact as a resistant cap, we cannot ignore the prospect that the past three months’ impressive recovery is just” a (B-Wave) corrective rebuttal to Sep-Dec’s initial counter-trend collapse ahead of another Sep-Dc-like meltdown to continue or complete a major consolidative structure similar to that that unfolded from May’15 until Feb’16 circled in blue below. In that previous correction the weekly log chart below shows how severely the market tested May’15’s 2134 high in Nov;’15 before collapsing once again for an ultimate correction of 15.5% that spanned nine months.
IF/when the market fails below 08-Mar’s 2726 larger-degree corrective low, there is no telling how deep the subsequent fall-out will be. It may only retrace 38.2% to the 2642-area before the secular bull resumes or it could disintegrate to or below Dec’s 2317 low. What we know with specificity is where a bullish policy is broken and defensive measures needed: 2726.
Contributions to this peak/reversal threat in equities also come from the continued decline in interest rates (discussed below) and a growing peak/reversal threat in copper (discussed later today in a webcast).
These issues considered, shorter-term traders are advised to move to a neutral/sideline position and are further advised to consider a cautious bearish position from 2835 OB with a recovery above 2866 negating this call and reinstating the bull. Longer-term players remain advised to maintain a bullish policy and exposure with a failure below 2726 required to threaten this call enough to warrant moving immediately to a neutral/sideline policy to circumvent the depths unknown of a larger-degree correction or reversal lower.
JUN 10-Yr T-NOTES
Last week’s accelerated uptrend and bust-out above 03-Jan’s 123.055 high reaffirms our broader bullish count and leaves smaller- and larger-degree corrective lows in its wake at 123.09 and 122.20, respectively, that the market is now required to fail below to threaten or negate our bullish count. Per such these levels represent our new short- and longer-term risk parameters to a still-advised bullish policy.
Former 122.30-to-123.05-area resistance is expected to hold as new support.
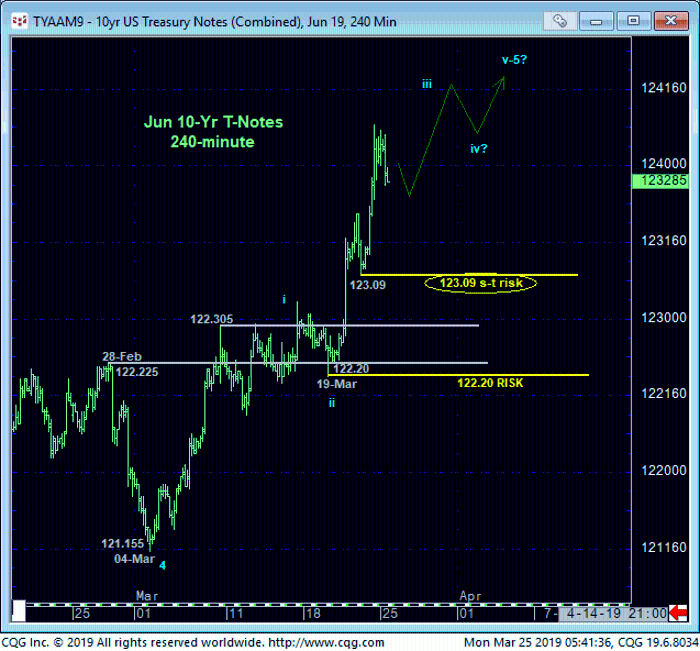
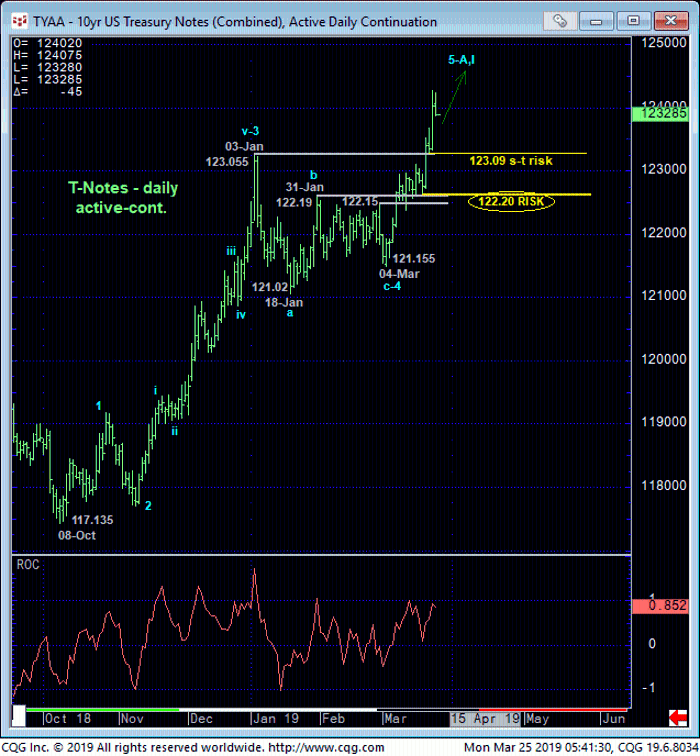
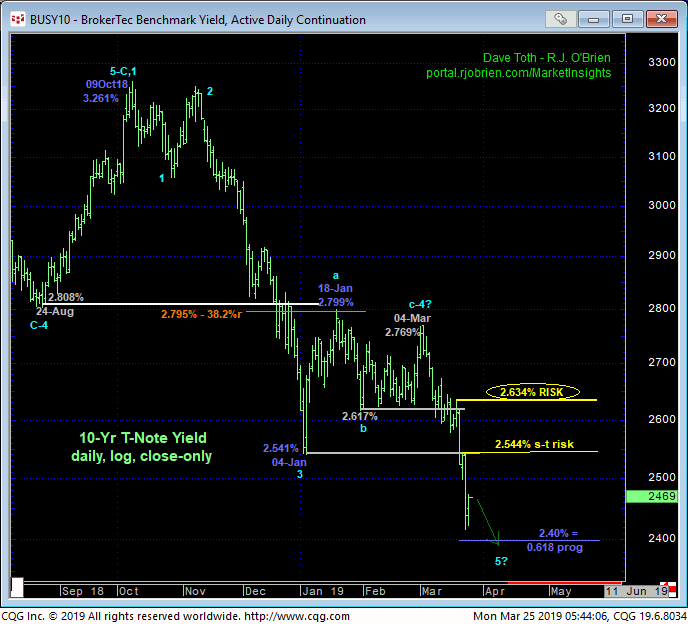
The daily chart of the contract above and 10-yr yields below show the clear and present uptrend in prices and downtrend in yields. The move from 04-Mar’s 121.15 low (2.769% high) could be the completing 5th-Wave of a major Elliott sequence from last Oct’s major low price (high yield). BUT ONLY a confirmed bearish divergence in momentum below 122.20 (above 2.634%) will stem the trend and expose a correction or reversal lower (higher). In lieu of such a mo failure the current uptrend should not surprise by its continuance or acceleration.
Lastly, on a major weekly basis, the chart of the contract below shows NO levels of any technical merit shy of Sep’17’s 127.28 high. This doesn’t mean we’re forecasting a move to 127.28, but it certainly does mean that the market’s upside potential is indeterminable and potentially severe until and unless the market fails below the corrective lows specified above.
In sum, a full and aggressive bullish policy remains advised with a failure below 123.09 required for shorter-term traders to move t the sidelines. Commensurately larger-degree weakness below 122.20 is required for longer-term players to take similar defensive steps. In lieu of such weakness further and possibly accelerated gains remain expected.

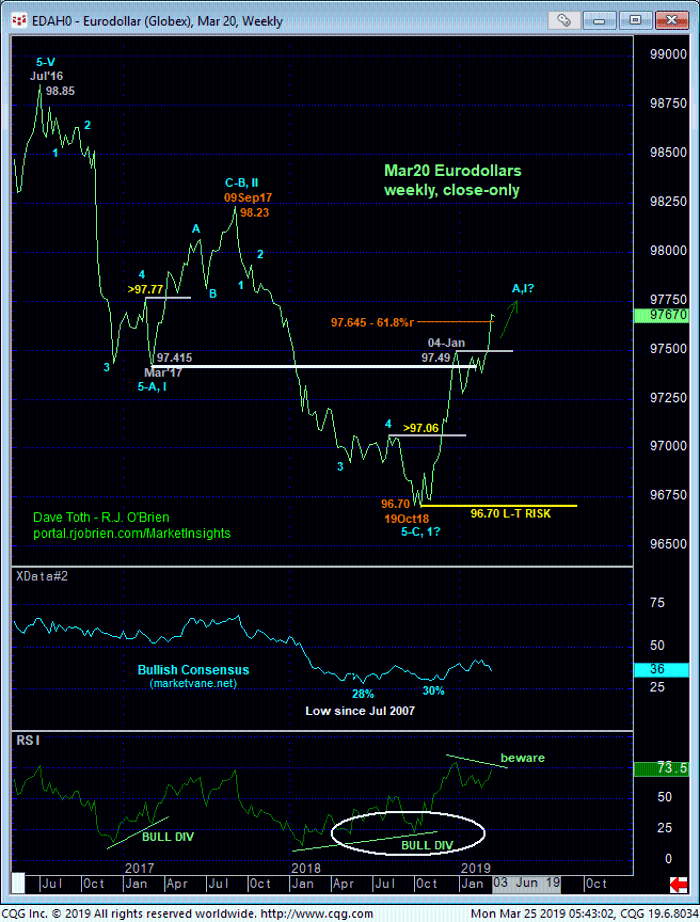
MAR20 EURODOLLARS
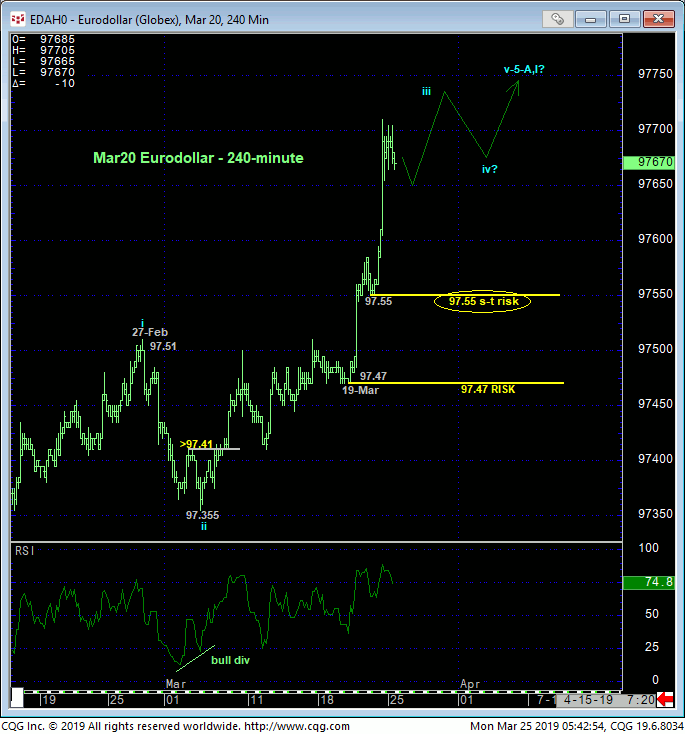
The technical construct and expectations for the Mar20 Eurodollar market are virtually identical to those detailed above for T-notes with smaller- and larger-degree corrective lows and short- and longer-term risk parameters identified at 97.55 and 97.47, respectively. In lieu of weakness below at least 97.55, setback attempts remain advised to first be approached as corrective buying opportunities. Former 97.60-to-97.50-area resistance is expected to hold as new support
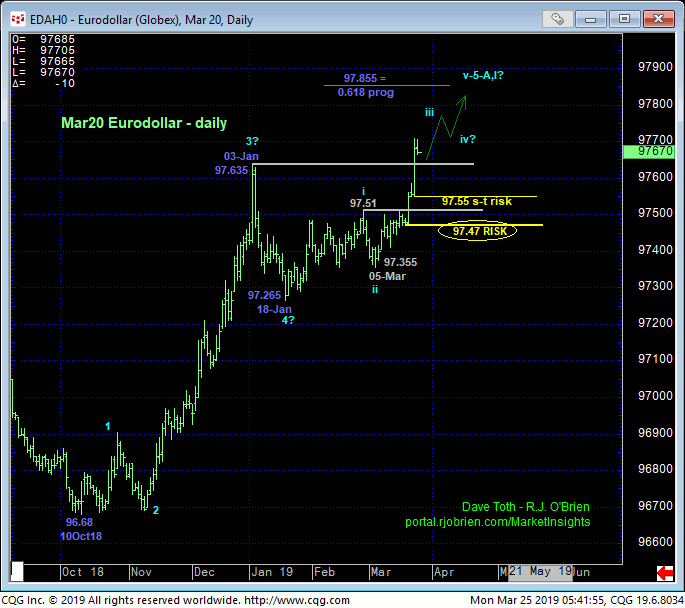
In sum, a bullish policy and longs from 97.42 OB recommended in 07-Mar’s Trading Strategies Blog remain advised with a failure below 97.55 required for shorter-term traders to step aside and commensurately larger-degree weakness below 97.47 for long-term players to take similar defensive action. In lieu of such weakness further and possibly accelerated gains remain expected.
