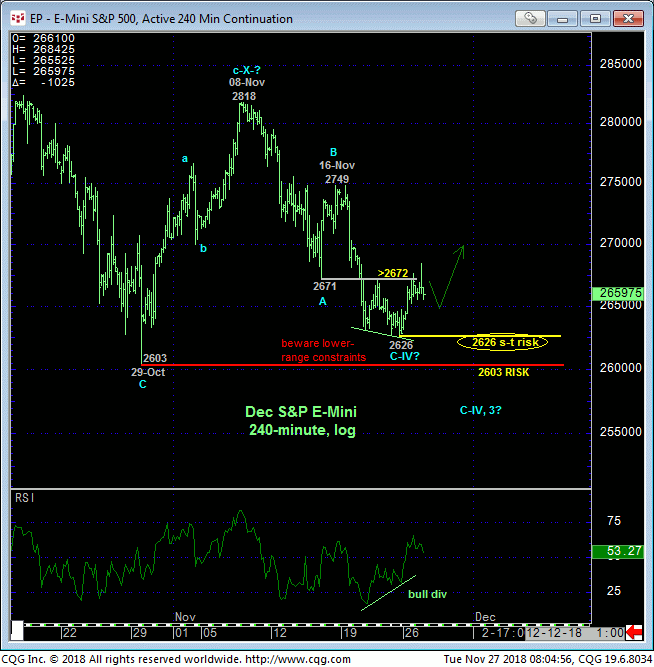
In yesterday’s Technical Blog we identified 2672 as the minor corrective high the market needed to sustain losses below to avoid confirming a bullish divergence in momentum. Yesterday afternoon and overnight the market broke this level and confirmed the divergence on an admittedly very minor scale. Nonetheless this mo failure defines Fri’s 2626 low as one of developing importance and our new short-term risk parameter from which non-bearish decisions like short-covers and cautious bullish punts can now be objectively based and managed.

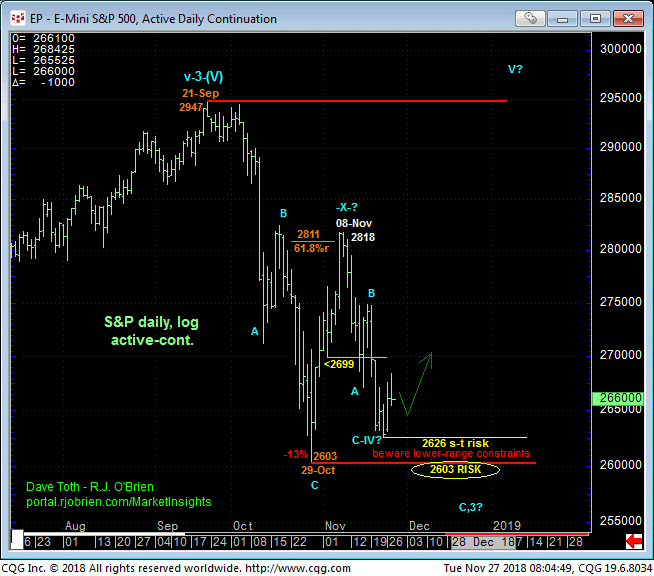
CLEARLY, in and of itself, this short-term mo failure only allows us to conclude the end of the recent downtrend from 16-Nov’s 2749 high. This divergence is of an insufficient scale to conclude the end of the broader relapse from 08-Nov’s 2818 high, let alone the end of a major bull market correction from 21-Sep’s 2947 all-time high. Indeed, the past few days’ hiccup falls easily within the bounds of a minor bear market correction ahead of further crash-&-burn below not only last week’s 2626 low, but also 29-Oct’s obviously key 2603 low.
HOWEVER, stemming from the extreme lower recesses of the past couple of months’ range and with some compelling ancillary evidence listed below, we believe an acute and favorable risk/reward condition exists from the bull side as long as 21-Sep’s 2626 low holds as a short-term but very important risk parameter.

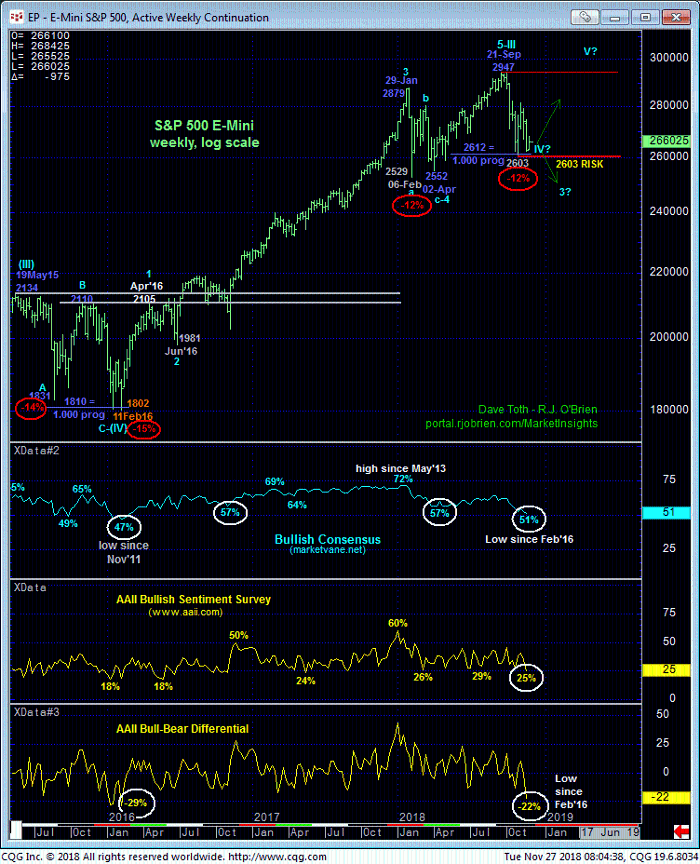
In addition to the market’s proximity to the extreme lower recesses of the past couple months’ range, there are two key factors in the weekly log chart below that are hard to ignore as factors that warn of what could be significant gains in the period ahead and, again, as long as the recent 2626-to-2603-range holds as support.
First, market sentiment has understandably sunk to historic lows typical of the ENDS of corrections and resumptions of the secular bull. The Bullish Consensus (marketvane.net) has dropped to a 51% reading not seen since Feb’16. The American Association of Individual Investors’ (AAII) Bullish Sentiment Survey has dropped to 25% while the AAII Bull-Bear Differential has collapsed to -22%, also the lowest since that Feb’16 period that saw the end of an 8-month correction and resumption of the secular bull.
Is this week’s bullish divergence in very short-term momentum sufficient to render contrary opinion/sentiment data applicable as a technical tool? No. But this short-term mo failure IS enough to define 2626 as an objective risk parameter from which to base non-bearish decisions like short-covers and cautious bullish punts.
Additionally, we find it very interesting that the Sep-Oct’s 11.5% decline is virtually identical in length (i.e. 1.000 progression) to Jan-Apr’s 11.3% correction from 2879 to 2552.
Are these facts enough to conclude a resumption of the secular bull? No. But until and unless the market relapses below 2626, we believe they present a risk/reward opportunity from the buy side for traders that could morph into the same type of rally that began with 02-Apr’s 2552 low. A relapse below 2626 will negate this specific bullish count, reinstate the slide from 08-Nov’s 2818 high and expose a run at 29-Oct’s key 2603 low and potentially extensive losses below that point. Resumed strength above overnight’s 2684.25 high will reinforce this bullish call and expose potentially surprising gains thereafter.
In sum, we advise a cautious bullish position from 2645 OB or following a recovery above 2684.25 with a failure below 2626 required to negate this call and warrant its immediate cover.


