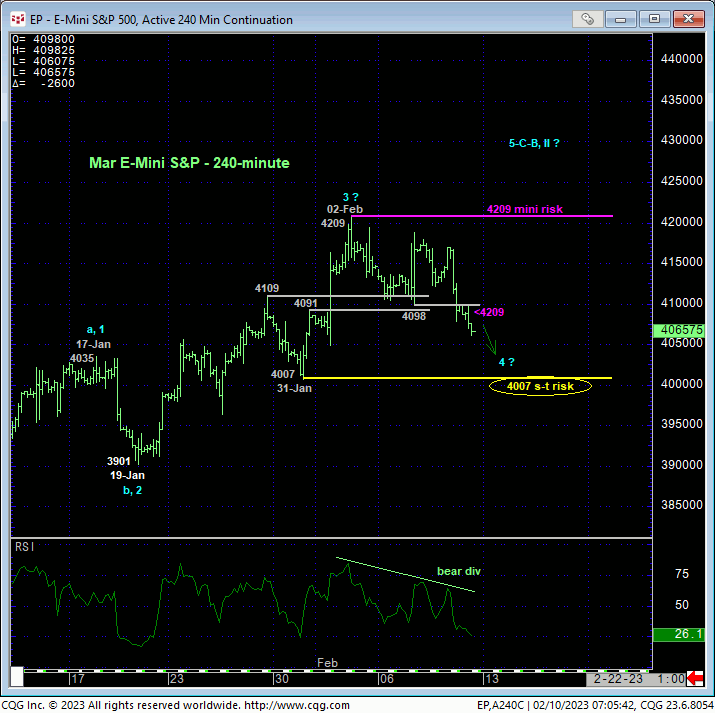
In Wed’s Technical Blog we extolled the market’s resilience in the face rebounding interest rates as a result of last Fri’s monstrous jump in nonfarm payrolls, identifying Tue’s 4209 low as a very short-term risk parameter the market needed to fail below to defer or threaten the broader uptrend from 22-Dec’s 3788 low. The 240-min chart below shows yesterday’s failure below this mini bull risk parameter that confirms a bearish divergence in very short-term momentum. This mo failure is of an insufficient scale to conclude anything more than a slightly larger-degree corrective hiccup within the broader uptrend. but it does suffice to conclude 02-Feb’s 4209 high as one of developing importance and a mini risk parameter from which non-bullish decisions like long-covers can be objectively based and managed by short-term traders.
This mini mo failure now places emphasis on 31-Jan’s 4007 next larger-degree corrective low, the failure below which will, in fact, break the uptrend from 22-Dec’s 37688 low and confirm AT LEAST a larger-degree correction lower and, per some interesting longer-term elements we’ll discuss below, possibly the threat of a resumption of the new secular bear trend. Per such, 31-Jan’s 4007 remains intact as our short-term but a key bull risk parameter.
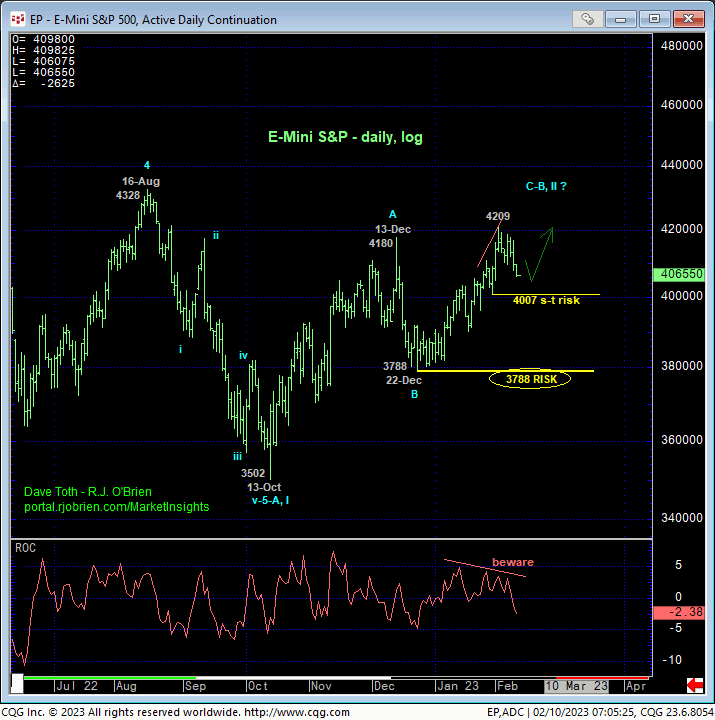
On a broader scale, the daily log chart below shows the nicely developing potential for a bearish divergence in momentum. This divergence will be considered CONFIRMED to the point of non-bullish action like long-covers of proof of intermediate-term weakness below 31-Jan’s 4007 corrective low, breaking the uptrend from 22-Dec’s pivotal 3788 low. Such a sub-4007 failure would only allow us to conclude the end of Dec-Feb’s uptrend. But this would present one of only two consequences: a larger-degree correction of Dec-Feb’s uptrend within a broader bullish count or its reversal to eventual new lows below 3788 that would render Oct-Feb’s entire recovery a 3-wave and thus corrective event that would re-expose last year’s secular bear market.
The crucial long-term takeaway from this analysis is that the specific levels and thresholds identified above are the levels from which to gauge either a broader bullish count or bearish count. If this market has something broader to the bull side in mind, then it should hold above 4007 and absolutely must hold above 3788. Conversely, if the recovery from last Oct’s 3502 low is a correction within a new secular bear market, weakness of various scales below levels like 4007 and especially 3788 must be proven to resurrect the major bear.
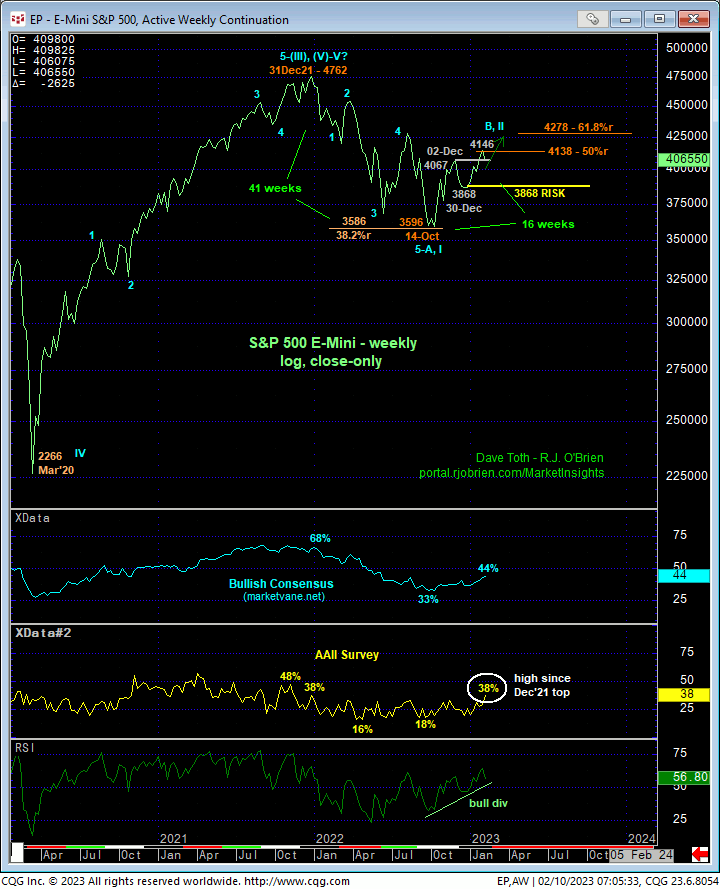
Stepping back a bit further, and what is interesting about yesterday’s admittedly mini mo failure and will become even more interesting on a failure below 4007 is that last Fri’s 4146 high weekly close is only 8-pts away from the (4138) 50% retrace of last year’s entire 4762 – 3596 decline on a weekly log close-only basis below. It may also prove interesting that the recovery from 14Oct22’s 3596 low has spanned 16 weeks to last Fri’s high, exactly 38.2% of 31Dec21-to-14Oct22’s 41-week decline. Alone, these Fibonacci facts are only of passing interest. BUT IF further momentum weakness below 4007 reinforces a market-driven peaking process, they become more applicable.
Additionally, the weekly chart below shows a return to a benign 44% reading in the Bullish Consensus (marketvane.net) measure of market sentiment/contrary opinion that won’t inhibit a move either way. Perhaps even more importantly, the American Association of Individual Investors (AAII) Sentiment Survey has recovered to a 38% level as of yesterday. This is the highest this indicator has been since the last week of Dec 2021, THE WEEK of the all-time high weekly close at 4762. The takeaway here is that the consensus is warming up to a resumed comfort level being bullish on stocks. This is fine and of no matter to a bullish count as long as the bull continues to BEHAVE LIKE ONE by sustaining trendy, impulsive behavior higher. Further slippage below 4007 won’t allow us to conclude a resumption of last year’s major bear, but it would be another building block to such, with the coup de grace, we believe, coming on a major momentum failure below 3788.
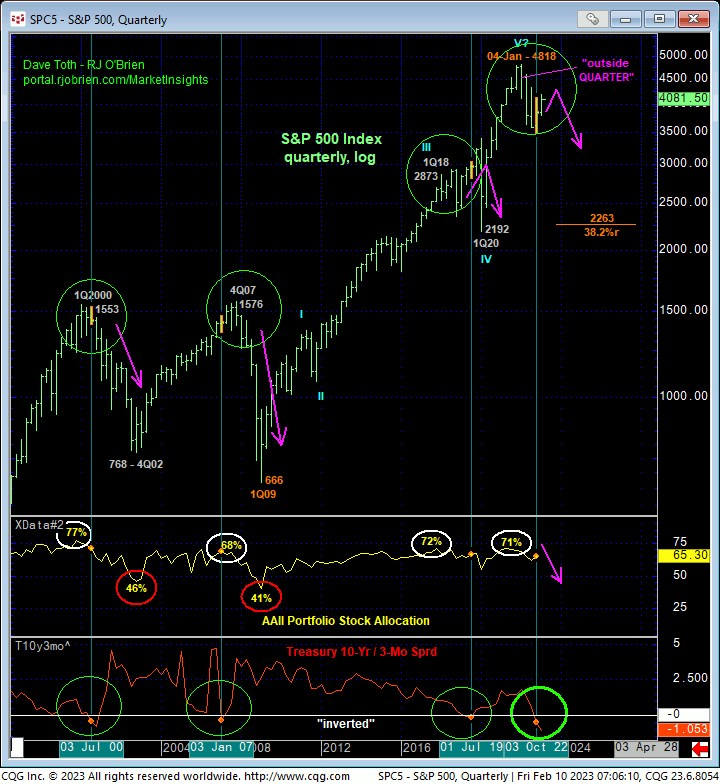
Finally and on an even longer-term quarterly log scale below, the massive peak/reversal elements introduced a year ago remain intact until/unless negated by a recovery above 04Jan22’s 4808 high in the contract and 4818 high in the actual S&P 500 Index. Against this backdrop, not the least of which is the inverted yield curve that has been a warning signal of other major bear markets, the past four months’ recovery falls well within the bounds of a mere correction. Again, commensurately larger-degree weakness below 22-Dec’s 3788 low remains required to resurrect a major bearish count, but near-term weakness below 31-Jan’s 4007 low would be the next hurdle to that broader bearish gateway. To mitigate this developing threat, the market needs to recoup last week’s 4209 high.
These issues considered, very short-term traders have been advised to move to a neutral/sideline position with a recovery above 4209 required to negate this call, reinstate the recovery and warrant a return to a bullish stance. Intermediate-term traders are advised to pare bullish exposure to more conservative levels and jettison remaining exposure on a failure below 4007, the break of which should also be taken as the occasion for longer-term institutional players and investors to pare bullish exposure to more conservative levels. In effect, we believe this market has identified 4209 and 4007 as the relatively short-term but key directional flexion points heading forward.