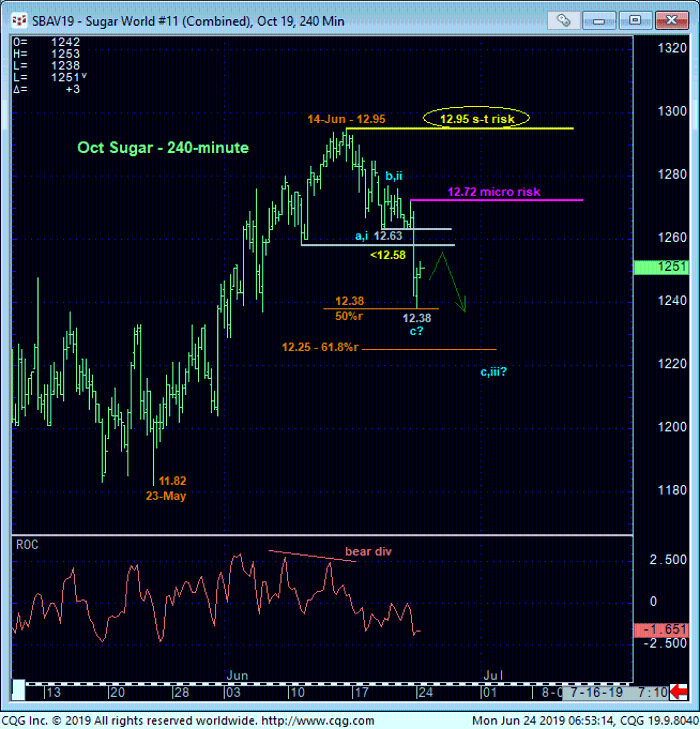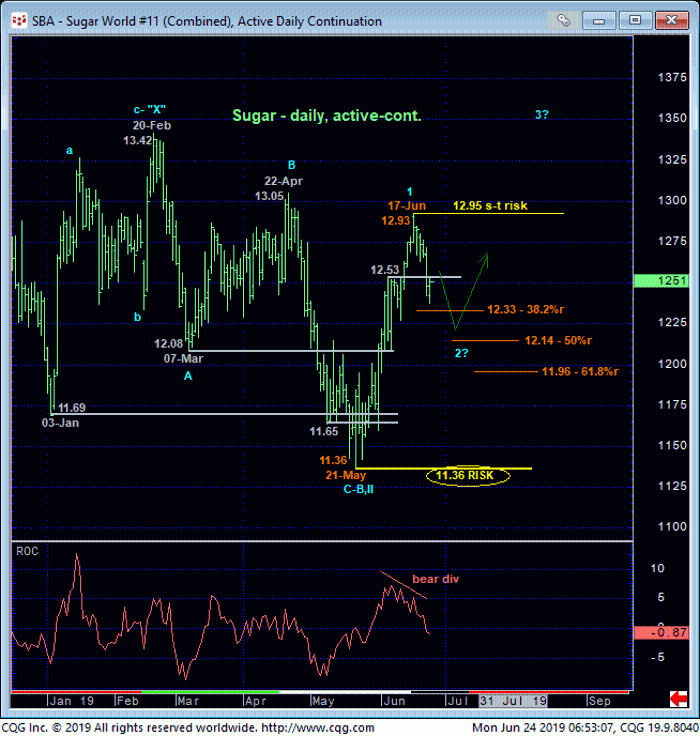
Fri’s failure below 11-Jun’s 12.58 corrective low in the now-prompt Oct contract and short-term risk parameter discussed in 13-Jun’s Technical Blog (below 12.27 in the Jul contract) confirms a bearish divergence in momentum that defines 14-Jun’s 12.95 high as the end of the rally from 23-May’s 11.82 low in the Oct contract (from 23-May’s 11.36 low in the then-prompt Jul contract). As a direct result of this momentum failure, the market has defined that 14-Jun high at 12.95as our new short-term risk parameter from which traders can objectively base non-bullish decisions like long-covers and cautious bearish punts.
On a short-term basis detailed in the 240-min chart below, the trend is clearly down with former 12.63-area support considered new near-term resistance and Fri’s 12.72 high a very short-term corrective high that traders can consider a micro risk parameter from which cautious bearish exposure can be objectively managed. A recovery above 12.72 will expose the sell-off attempt as a 3-wave and thus corrective affair we suspect this relapse to be, but until and unless the market recoups 14-Jun’s 12.95 high, this correction can unfold laterally-to-lower for weeks more.

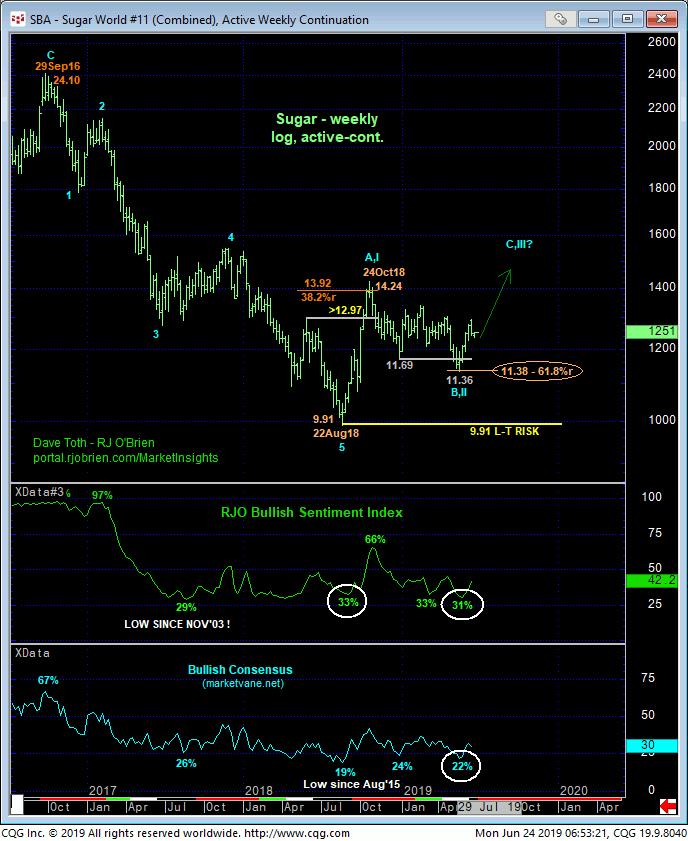
It is interesting to note that basis the Oct contract above, today’s 12.38 low thus far is the exact 50% retrace of May-Jun’s 11.82 – 12.95 rally. On a daily active-continuation basis below however, the market has thus far failed to retrace even a Fibonacci minimum 38.2% of May-Jun’s 11.36 – 12.93 rally. Regardless, the market has been accommodative in defining levels like 12.95 and even 12.72 as those the market needs to recoup to reinforce our long-term bullish count that contends this relapse is a (2nd-Wave) correction of May-Jun’s rally within the context of what we believe is a massive base/reversal process that dates from Aug’18’s 9.91 low. In this very long-term regard 21-May’s 11.36 low remains intact as our key long-term risk parameter the market remains required to break to negate this long-term bullish count. From this longer-term perspective, what price action lies between spot and that 11.36 low is anyone’s guess. But we know exactly what levels the market needs to recoup to mitigate further lateral-to-lower prices: 12.72 and certainly 12.95.

The key factors on which our long-term bullish count are predicated include:
- Aug-Oct’18’s bullish divergence in WEEKLY momentum that, in fact, broke the secular downtrend
- the complete 5-wave Elliott sequence down from Sep’16’s 24.10 high
- the extent and (5-wave) impulsiveness of Aug-Oct’18’s rally
- the clear 3-wave and thus corrective structure of Oct’18 – May’19’s relapse from 14.24 to 11.36
- the exact 61.8% retrace of Aug-Oct’18’s 9.91 – 14.24 rally
- historically bearish sentiment levels warning of and accompanying May’s base/reversal threat.
These are the reasons why we believe long-term players should approach the current relapse as a corrective buying opportunity that could be extraordinarily lucrative and opportunistic as the potential pay-off would be a Aug-Oct’18-like rally to levels potentially well above Oct’18’s 14.24 high. But until and unless this market recovers above at least 12.72, further and possibly extensive corrective behavior south should not surprise.
These issues considered, shorter-term traders have been advised to move to a neutral/sideline position as a result of Fri’s mo failure. Cautious bearish exposure from the 12.60 level OB is OK with a recovery above 12.72 required to negate this count and warrant its cover. A bullish policy remains advised for long-term players with a failure below 11.36 required to negate this count and warrant its cover. The interim paring of bullish exposure to more conservative levels is OK to reduce interim exposure to further correction, but this acknowledges and accepts whipsaw risk that would warrant reversing that liquidating on a recovery above at least 12.72 and then certainly 12.95.


