Posted on Jan 30, 2024, 05:56 by Dave Toth
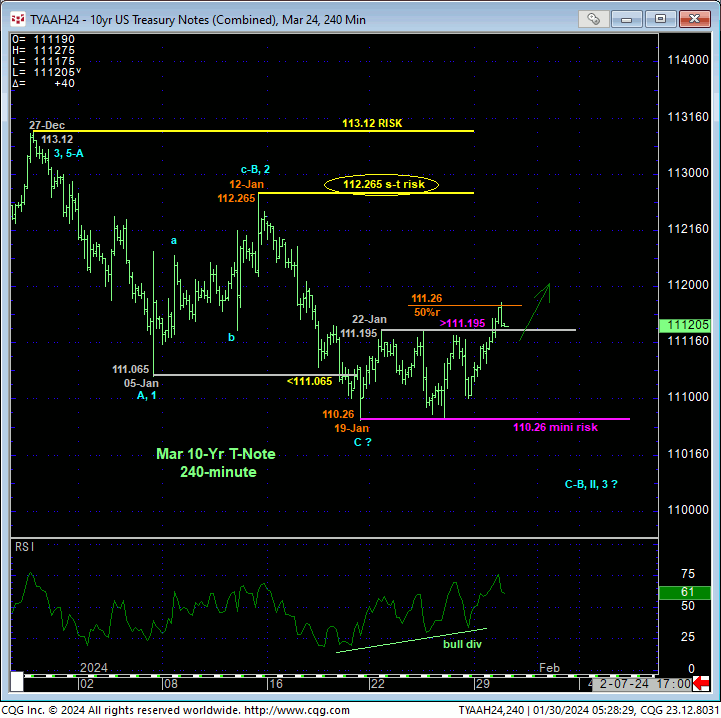
The 240-min chart below shows that yesterday afternoon’s recovery above 22-Jan’s 111.195 initial counter-trend high confirms a bullish divergence in short-term momentum. This mo failure is of an insufficient scale to conclude the end of a suspected correction down from 27-Dec’s 113.12 high introduced in 03-Jan’s Technical Blog. But it IS sufficient to conclude 19-Jan’s 110.26 low as one of developing importance and a mini parameter from which non-bearish decisions like short-covers and cautious bullish punts can be objectively based and managed.
Indeed, the sell-off attempt from 27-Dec’s 113.12 high is clearly only a 3-wave affair thus far. And left unaltered by a relapse below 110.26, this 3-wave setback easily qualifies as a corrective/consolidative event that warns of a resumption of Oct-Dec’s uptrend that preceded it. However, commensurately larger-degree strength above 12-Jan’s 112.265 corrective high remains required to CONFIRM this setback as a 3-wave affair. Until such strength is proven and given that the past week-and-a-half’s recovery has thus far only retraced 50% of the decline from 112.265 to 110.26, it would be premature to conclude that the recent pop isn’t just another smaller-degree corrective hiccup within a larger-degree correction of Oct-Dec’s broader uptrend. In effect, we believe this market has identified 110.26 and 112.265 as the relatively short-term but key flexion points around which traders can objectively toggle directional biases and exposure.


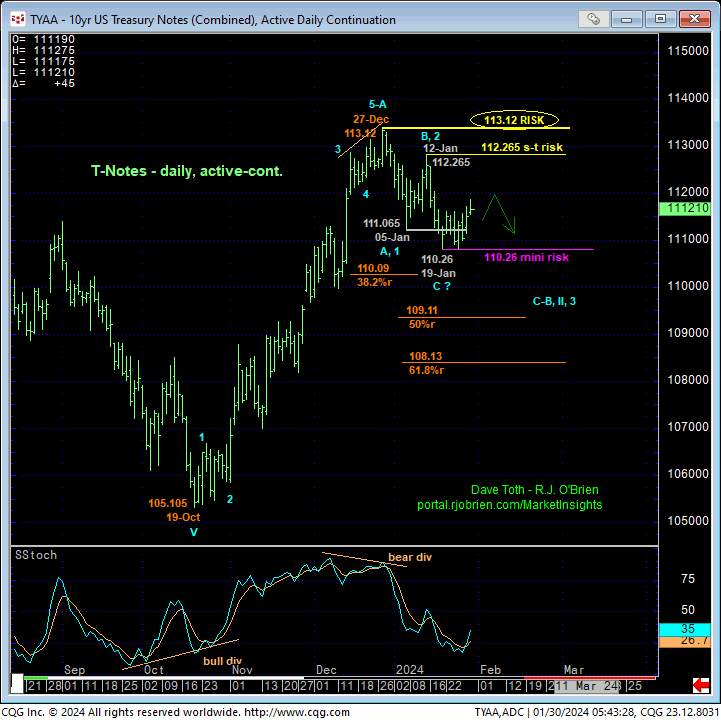
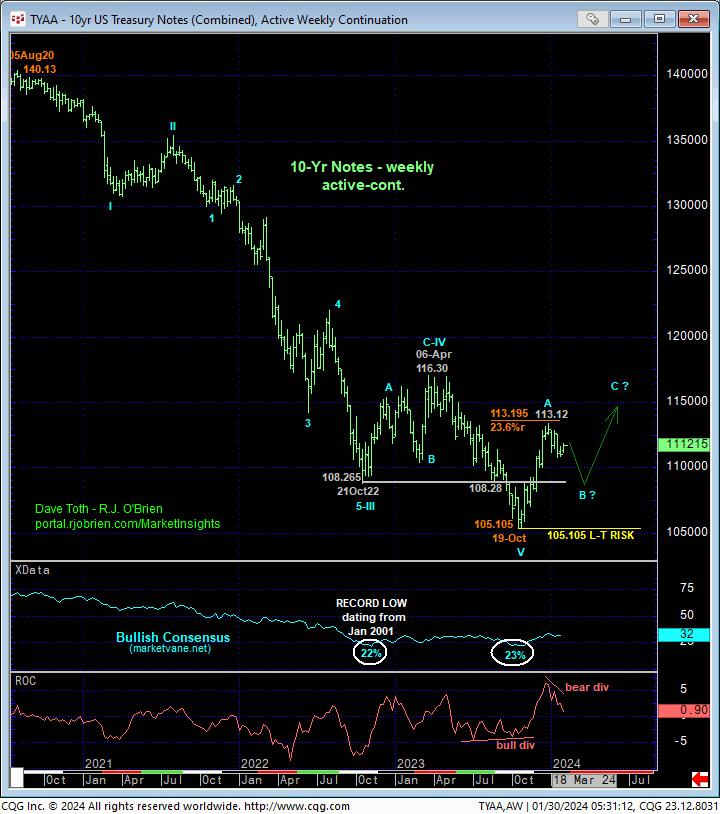
On a longer-term basis, it’s clear that the setback from 27-Dec’s 113.12 high is sufficient to break Oct-Dec’s uptrend. The technical and trading challenge now is discerning the extent or scale of the suspected (B- or 2nd-Wave) correction back down within what we believe is a major base/reversal process up from 19Oct23’s 105.105 low. ”Typically”, such corrective rebuttals to initial count6er-trend rallies that stem from the end of massive downtrends such as Aug’20 – Oct’23’s collapse are “more extensive” in price and time, often times retracing 61.8% or more of that initial counter-trend move, as the forces that have driven such a mammoth 3-YEAR bear take time to dissipate and reverse. Such a “more extensive” correction would/could see the contract retrace to the 109- or 108-handle-areas in the weeks or even months ahead. This week’s bullish divergence in short-term momentum is not of a scale that would allow us to conclude that such a more significant correction lower isn’t still intact. A relapse below 110.26 will reinforce such a steeper corrective count while commensurately larger-degree strength above at least 112.265 will threaten it.
These issues considered, shorter-term traders are OK to pare or neutralize bearish exposure as a result of yesterday afternoon’s recovery above 111.195 and perhaps even take a cautious punt from the bull side, with a relapse below 110.26 negating this call, reaffirming the correction and exposing potentially much steeper losses thereafter. Intermediate-to-longer-term institutional players remain advised to maintain a cautious bearish policy with strength above 112.265 still required to threaten this call enough to warrant neutralizing this exposure.


