Posted on Aug 03, 2022, 06:51 by Dave Toth
SEP 10-Yr T-NOTES
Yesterday’s mini momentum failure below Fri’s 120.17 minor corrective low is of an insufficient scale to conclude the end of a suspected bear market correction we introduced in 24-Jun’s Technical Blog. But for some Elliott Wave and Fibonacci reasons we’ll discuss below, it is not premature to be aware of such a resumed bearish possibility until and unless the market nullifies this prospect by recovering above yesterday’s 122.02 high left in the wake of this admittedly minor momentum failure. Per such, this 122.02 level serves as a mini risk parameter from which non-bullish decisions like long-covers and bearish punts can be objectively based and managed.
The 240-min chart below shows larger-degree corrective lows at 119.155 and especially 117.145 that this market still needs to break to raise the odds and then confirm the recovery from 14-Jun’s 114.075 low as the 3-wave and thus corrective event we suspect it is. Per such and for longer-term players, these two levels remain intact as short- and longer-term bull risk parameters.


From a slightly longer-term perspective shown in the daily chart above, the not unimpressive recovery from 14-Jun’s 114.075 low is thus far only a 3-wave structure as labeled. Now again, this market needs to fail below 117.145 to CONFIRM this recovery as a 3-wave event. And even then, the market could continue to consolidate laterally between 114.075 and 122.02 for weeks or even months before resuming the secular bear trend. But the important takeaway is the market’s definition of yesterday’s 122.02 high as one of developing importance in this long-term bearish count and a level that could evolve into a pivotal flexion point around which to toggle longer-term directional biases and exposure.
Contributing to this bear market correction count is the fact that yesterday’s 122.02 high came within a 1/4-pt of the (122.10) Fibonacci minimum 38.2% retrace of the major bear trend from Aug’21’s 135.14 high to 14Jun22’s 114.075 low on a weekly active-continuation basis below. And given the magnitude of the secular bear trend and down-channel over the past two years, it is not hard at all to envision the past month-and-a-half’s recovery attempt as a mere correction within the secular bear market that has at least one more round of (5th-Wave) new lows to achieve below 117.145. If this bearish count is correct, again, the importance of yesterday’s admittedly minor momentum failure is that the market has identified a very early but precise risk level at 122.02 from which to objectively bet on such a move.

From a 10-yr yield perspective, the daily log close-only chart below shows 28-Jul’s close below 27-May’s 2.738% corrective low that confirms a bearish divergence in WEEKLY momentum, exposing a larger-degree correction or possible reversal lower in rates. And a daily close above 20-Jul’s 3.025% corrective high close is required to arrest this setback and confirm the decline from 14-Jun’s 3.489% high as a 3-wave and thus corrective structure that would reinforce our count that contends the secular bull trend in HIGHER rates remains intact. But given that rates have yet to retrace even a Fibonacci minimum 38.2% of the increase from Dec’21’s 1.348% low to 14Jun22’s 3.489% high, the past month-and-a-half setback falls well within the bounds of a mere (4th-Wave) correction. If this higher-rate count is wrong, all this rate market needs to do is sustain trendy, impulsive behavior to the downside (i.e. the Sep contract above 122.02). In lieu of such behavior, traders are advised to beware a rebound in rates that could morph into a resumption of the secular move higher in rates.
These issues considered, shorter-term traders are advised to move to a cautious bearish policy and exposure on a scale-up from the 120.00-to-121.00 with a recovery above 122.02 negating this call and warranting its cover. Longer-term institutional players are advised to pare bullish exposure to more conservative levels and reversal into a cautious bearish policy on a failure below 117.145.

DEC23 EURODOLLARS

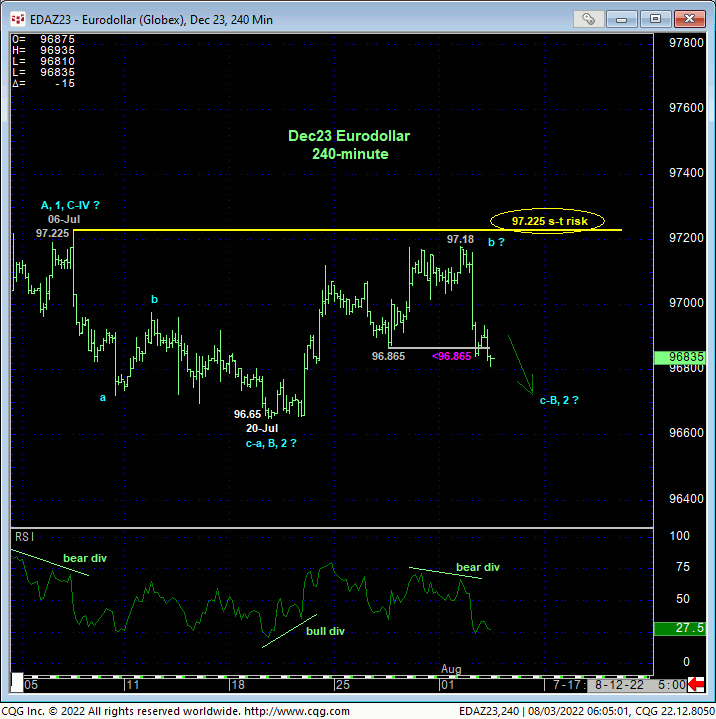
The technical construct of the Dec23 eurodollar market is essentially the same as that detailed above in T-notes following yesterday’s short-term momentum failure below last Wed’s 96.865 corrective low labeled in the 240-min chart above. Especially stemming from the extreme upper recesses of the past month’s range, we believe this sort-term mo failure reinforces 06-Jul’s 97.225 high as a key resistance level and risk parameter from which non-bullish decisions like long-covers and bearish punts can be objectively based and managed.
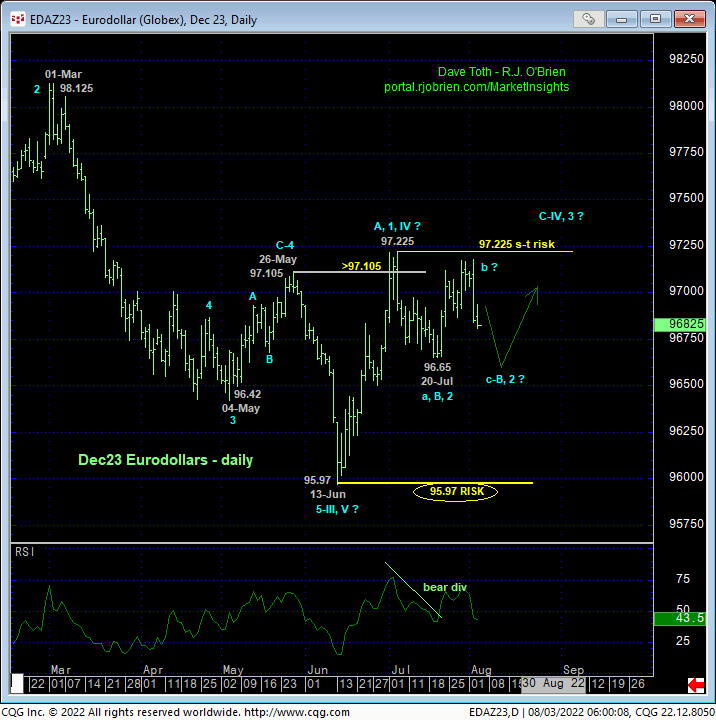
To be sure, yesterday’s relapse is far from sufficient to conclude that 97.225 high as the (4th-Wave) end of correction and that the secular bear trend is poised to resume. Indeed, this market could spend months consolidating between 97.225 and 13-Jun’s 95.97 low before the secular bear resumes. But against the backdrop of the secular bear trend, it’s also not hard to envision the past month’s labored behavior as that consistent with the end or upper boundary of such a larger-degree bear market consolidation.

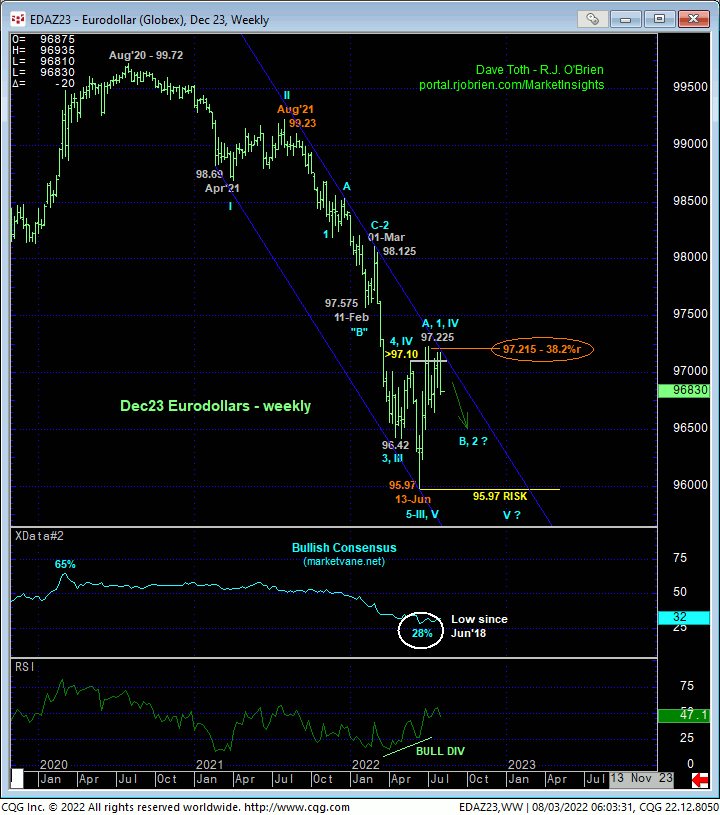
From a longer-term perspective, it’s easier to see the prospect that Jun-Jul’s recovery attempt is a mere (4th-Wave) correction within the secular bear market in the weekly chart below. The Fibonacci fact that this recovery attempt has thus far stalled in the exact area of the (97.215) 38.2% retrace of a suspected and major 3rd-Wave decline from Aug’21’s 99.23 high to 13-Jun’s 95.97 low would seem to reinforce this bear market correction count.
These issues considered, it is premature to conclude at this point and as a result of yesterday’s short-term failure below 96.865 that 06-Jul’s 97.225 high completed or defines the upper boundary of a major bear market correction. But it is not premature to shift to a cautious bearish policy with a recovery above 97.225 required to negate this specific call and warrant its cover. Per such, traders are advised to move to a cautious bearish policy at-the-market (96.82) and neutralize this exposure on a recovery above 97.225.


