Posted on May 08, 2023, 08:09 by Dave Toth
JUN 10-Yr T-NOTE
The market’s break above 06-Apr’s 116.30 high and resistance, failure to sustain that breakout and relapse below an area of former resistance-turned-support around the 115.30-area from 25-Apr mitigate a more immediate impulsive count and throw the market back into the lateral consolidative range that has gripped it since24-Mar’s 117.015 high. This past couple days’ relapse detailed in the 240-min chart below leaves Thur’s 117.00 high in its wake as one of developing importance and the level this market now needs to recoup to resurrect a broader base/correction/reversal count. Until and unless such strength is resurrected, further lateral-to-lower prices are expected in the continuation of a suspected larger-degree consolidative structure down from 24-Mar’s 117.015 high. Per such, last week’s 117.00 serves as our new short-term parameter from which the risk of non-bullish decisions like long-covers and cautious bearish punts can be objectively based and managed by shorter-term traders with tighter risk profiles.


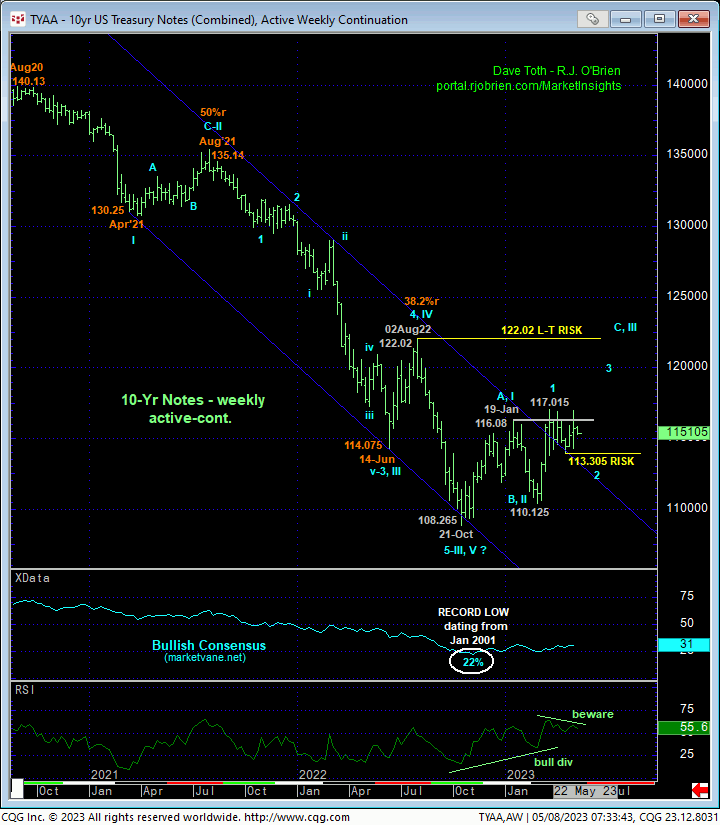
From a longer-term perspective, the daily chart above and weekly chart below show the broader base/correction/reversal count up from last Oct’s 108.265 low where commensurately large-degree weakness below 19-Apr’s 113.305 low remains minimally required to break the uptrend from 02-Mar’s 110.125 low, let alone threaten the broader 6-1/2-month basing structure. While a break below 113.305 won’t necessarily nullify a broader base/reversal count, the fact that there are NO levels of any technical merit between 113.305 and 02-Mar’s 110.125 low warrants a move to a neutral/sideline position by even longer-term institutional players. Per such, 113.305 remains intact as our key longer-term bull risk parameters pertinent to longer-term players. Indeed, the magnitude of the secular bear market from Aug’20’s 140.13 high is such that Oct’22 – May’23’s recovery attempt falls well within the bounds of a mere 3-wave correction. And the weekly chart below shows that a failure below 113.305 will confirm a bearish divergence in weekly momentum that could expose more protracted losses thereafter.
These issues considered, the market has identified 113.305 and 117.00 as the key directional flexion points heading forward. Traders are advised to toggle directional biases and exposure around these levels commensurate with their personal risk profiles. The market’s current position smack in the middle of this range presents poor risk/reward conditions from which to initiate directional exposure.

MAR24 SOFR

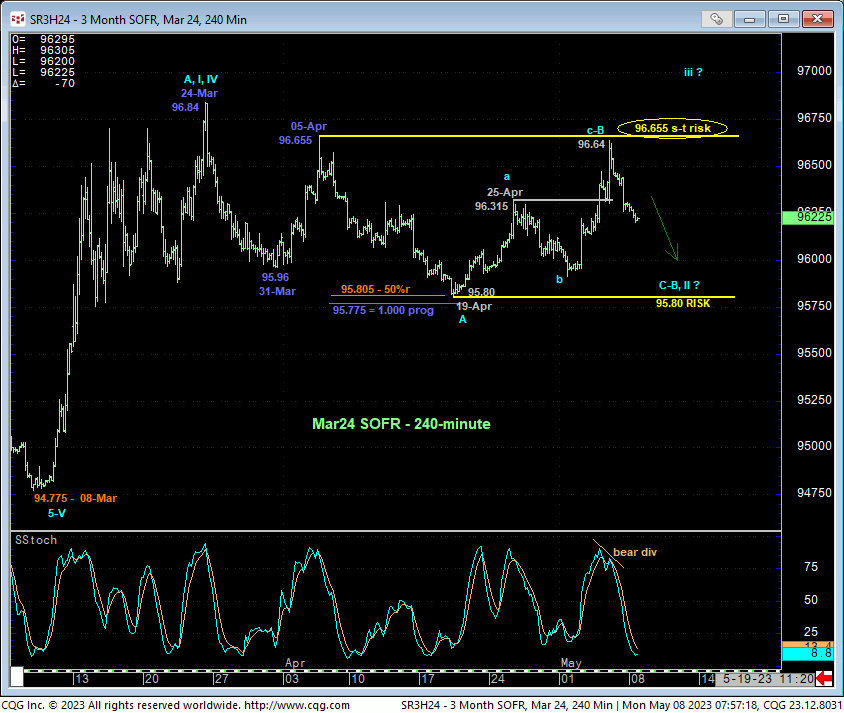
The market’s obvious rejection of the upper recesses of the 6-week range in general and of 05-Apr’s 96.655 high specifically throws the market back into the 6-week consolidation range ahead of likely further lateral-to-lower prices ahead. The technical construct is identical to that detailed above in the 10-yr with 05-Apr’s 96.655 high remaining intact as our key short-term bear risk parameter and 19-Apr’s 95.80 low considered our new long-term bull risk parameter pertinent to longer-term institutional players. A break below 95.80 will not negate our very long-term base/correction/reversal count, but since there are no levels of any technical merit between 95.80 and 08-Mar’s 94.775 low, even longer-term institutional players would be advised to neutralize bullish exposure on a failure below 95.80 to circumvent the depths unknown of a larger-degree B- or 2nd-Wave correction of Mar’s rally OR a resumption of the secular bear trend.
These issues considered, we believe this market has identified 95.80 and 96.655 as the key directional flexion points heading forward and traders are advised to toggle directional biases and exposure around these levels commensurate with their personal risk profiles. The market’s current position in the middle of this range presents poor risk/reward metrics from which to initiate directional exposure.

From a very long-term perspective, the market needs to break 03-Mar’s 95.01 low weekly close (and/or 08-Mar’s 94.775 intra-day low) to nullify a base/reversal count that could be major in scope. What the market might have in store for us between 95.80 and these early-Mar lows is too much of an unknown to warrant maintaining a bullish policy if the market breaks 95.80. NOT exiting bullish exposure on a break below 95.80 acknowledges and accepts bull risk to these early-Mar lows as there are NO levels of any technical merit below 95.80 shy of those early-Mar lows.


