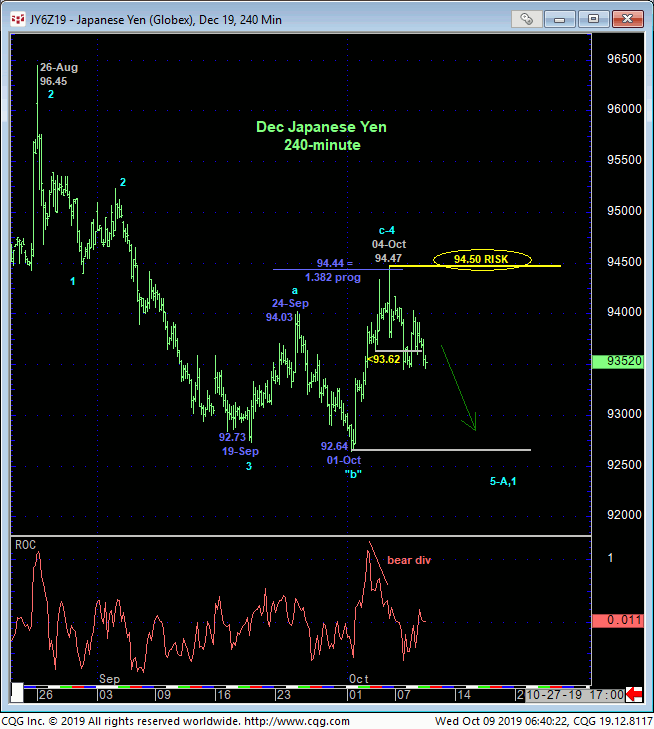
Mon’s break below 03-Oct’s 93.62 low confirms a bearish divergence in very short-term momentum. This mo failure defines last Fri’s 94.47 intra-day high as one of developing importance and a new risk parameter from which traders can objectively rebase and manage the risk of a resumed bearish policy. The Fibonacci fact that the rally from 01-Oct’s (suspected b-wave “irregular) 92.64 low was only a few pips from the (94.44) 1.382 progression of mid-Sep’s preceding 92.73 – 94.03 pop would seem to reinforce the bearish prospect that the past few weeks’ recovery attempt is a 3-wave and thus corrective affair consistent with our longer-term peak/reversal count.


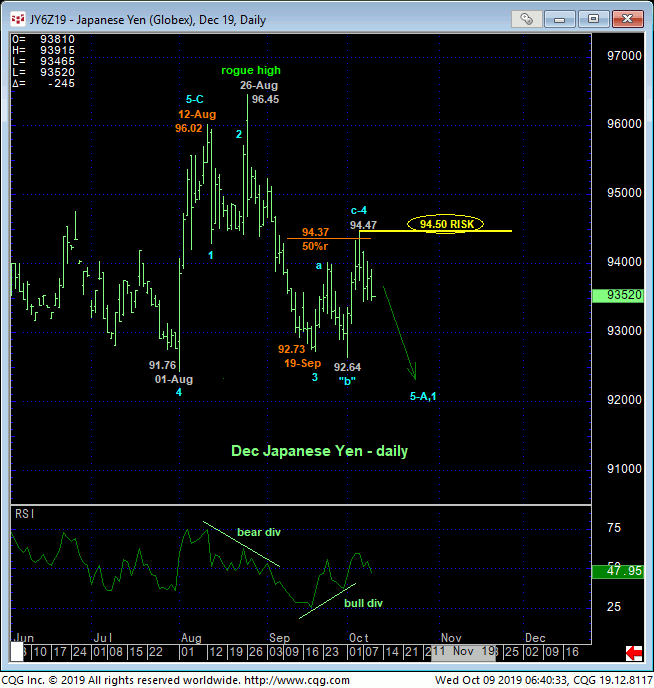
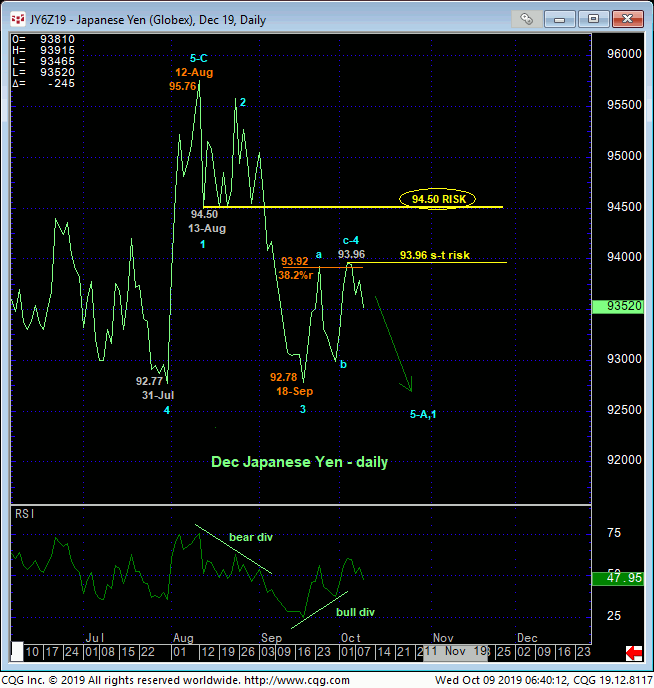
On a daily basis we’ve done a re-think on the wave count down from the Aug high, considering 26-Aug’s spasm to a 96.45 intra-day high as a rogue event and part of just a 2nd-Wave corrective retest of highs from 12-Aug. This count is clear on a daily close-only basis below, suggesting the current downtrend began on 12-Aug, not 26-Aug. But regardless of where the slide started, thus far, the recovery attempt from 18-Sep’s 92.78 low close has only sub-divided into a 3-wave structure as labeled in either daily chart, stalling at the 38.2% retrace area of Aug-Sep’s decline on a close-only basis below and the 50% retrace area on a daily high-low basis above.
Since 13-Aug’s 94.50 low close is arguably the end of the 1st-Wave down from the 12-Aug high and since last Fri’s intra-day high was 94.47, we’re going to call 94.50 as our new longer-term risk parameter to a resumed bearish count.

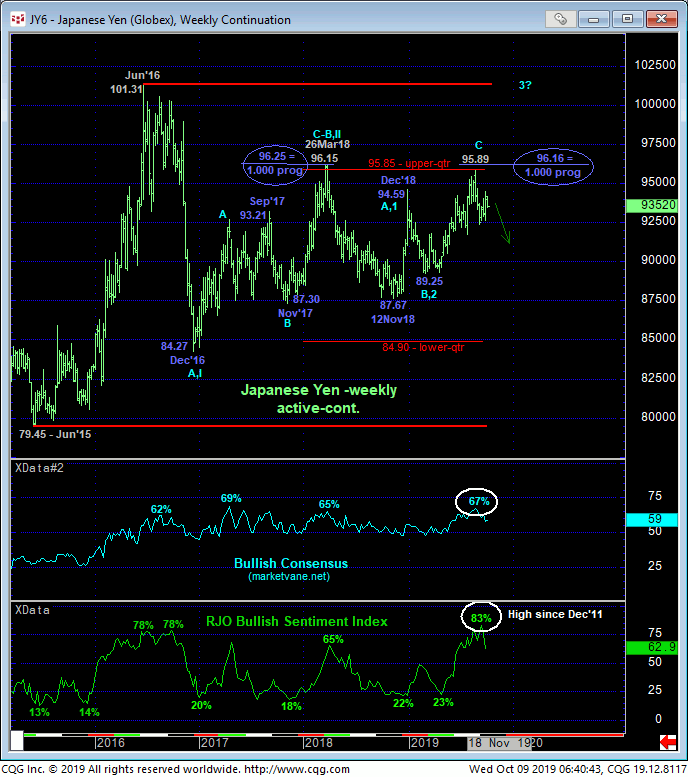
On a longer-term basis we introduced our major peak/reversal count in 05-Sep’s Technical Blog predicated on:
- 05-Sep’s bearish divergence in momentum
- another 3-wave and thus corrective structure from Nov’18’s 87.67 low similar to Dec’16 – Mar’18’s 3-wave affair
- another rejection of the upper-quarter of the incessant FOUR YEAR lateral range and
- historically frothy bullish sentiment not seen since Dec 2011 DESPITE the fact that the market remains deep within a mere lateral range.
These issues considered, traders are advised to return to a bearish policy and exposure from at-the-market (93.50) with a recovery above 94.50 required to negate this call and warrant its cover. In lieu of such 94.50+ strength, we anticipate a resumption of the downtrend from 12-Aug’s high to new and potentially significant lows below 92.64 that could span months or even quarters.


