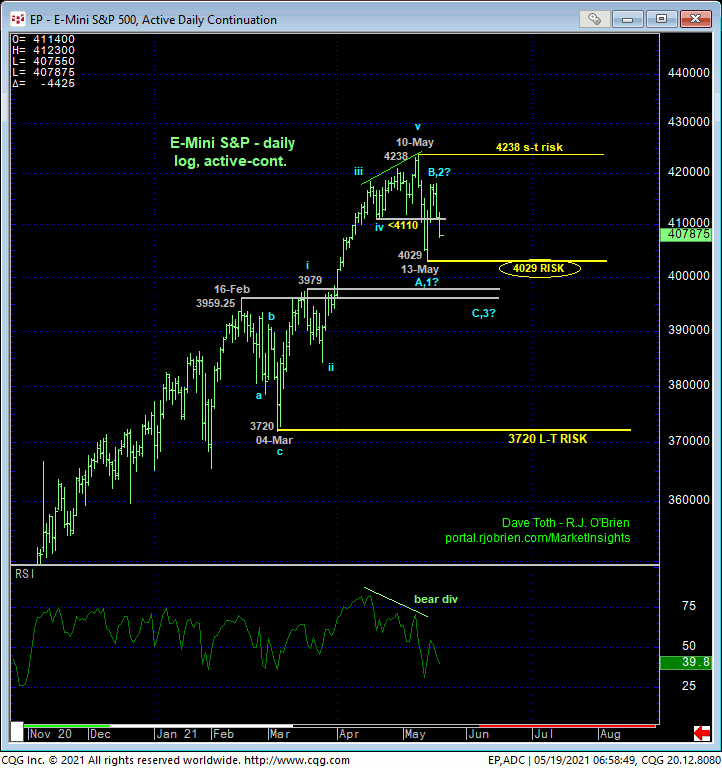
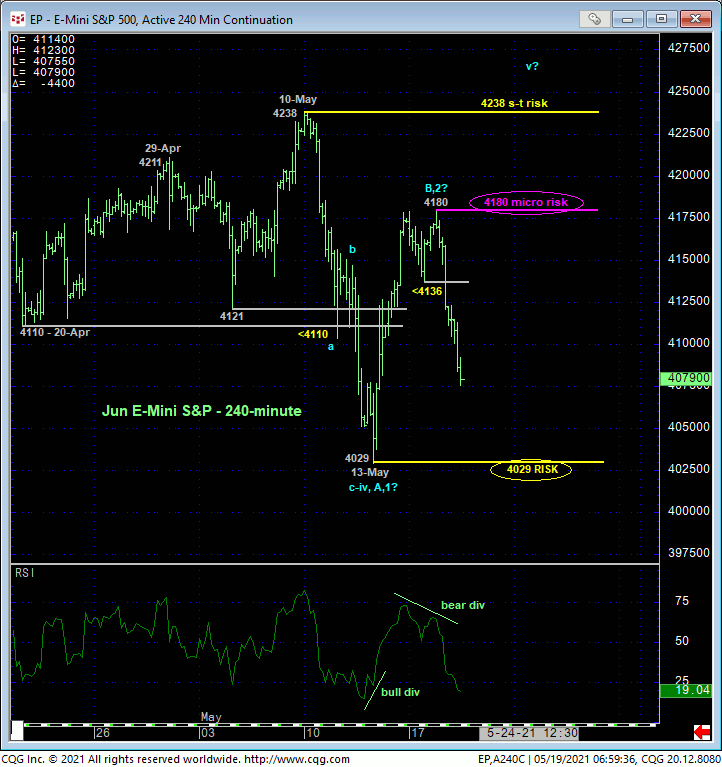
While the market hasn’t breached 13-May’s pivotal 4029 low and key bull risk parameter yet, the extent and impulsiveness of yesterday and overnight’s plunge following a bearish divergence in short-term momentum below 4136 is disconcerting. This mo failure defines yesterday’s 4180 high as one of developing importance and a minimum level this market now needs to recoup to raise the odds that this month’s volatile but rangey price action between 10-May’s 4238 high and that 4029 low is merely corrective/consolidative within the still-unfolding secular bull trend. Until the market can recoup that 4180 high however, focus shifts to the crucial matter of whether the bull can hold above 4029.
Given the magnitude of the secular bull trend, even a break below 4029 would still fall well within the bounds of a mere correction. HOWEVER, below that point, the jury would be totally out on how deep that correction, OR broader reversal could drive down prices.
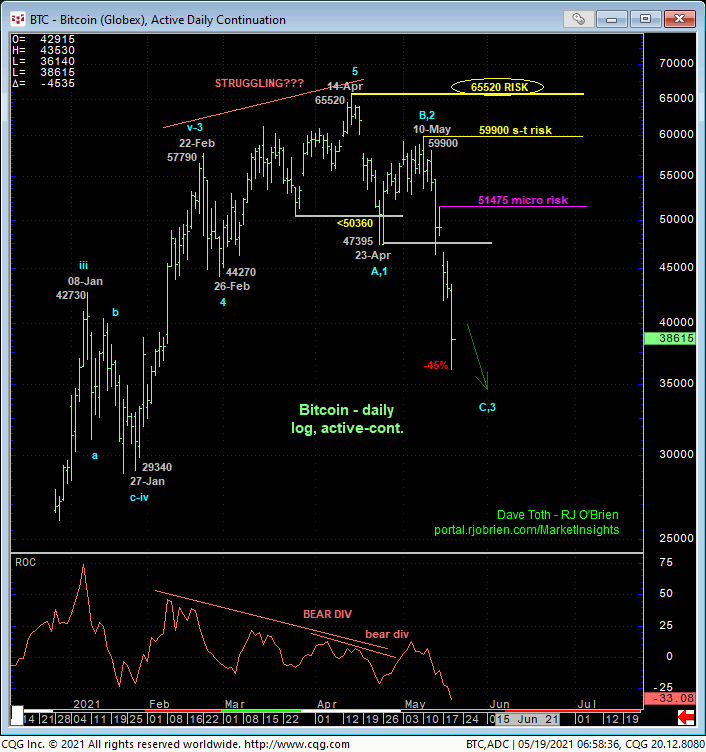
Before discussing some longer-term effects of a sub-4029 failure in the S&P, we’d like to show an excellent example of what vulnerabilities exist following a market’s break below an initial counter-trend low. In Mon’s Technical Blog we discussed bitcoin’s break below 23-Apr’s 47395 initial counter-trend low after previous peak/reversal-threat behavior. This break confirmed AT LEAST the intermediate-term trend, and possibly the new long-term trend as down, with the important by-product being the market’s definition of recent corrective highs and risk parameters as those this market now needs to recoup to defer or threaten a count calling for potentially massive losses. Until and unless this market recoups levels like Fri’s 51475 corrective high, the new trend is, in fact, down with indeterminable downside potential until stemmed by a countering bullish divergence in mo. This market has thus far lost 45% of its value in a month. Those remaining long bitcoin now only have hope for the market to recover. And hope is not an investment strategy.
Now we don’t mean for a second to imply that the bitcoin market is a leading indicator to S&P performance. We’re strictly talking about technical structure, discipline and ramifications of a market relapsing below and initial counter-trend low like the aforementioned 4029 threshold in the S&P. This said, these two markets have enjoyed a relative positive correlation for the past year.
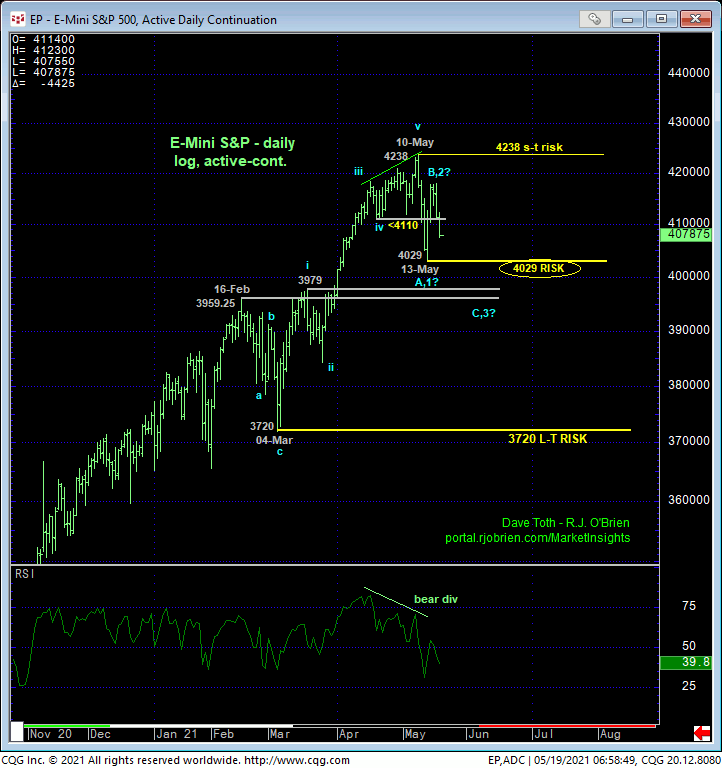
Back to the S&P, the end of last week’s rebound identified 13-May’s 4029 low (12-May’s 4052 close on a daily close-only chart below) as one of obvious developing importance and, against the backdrop of the secular bull trend, an arguable end or lower boundary to yet another mere correction within the secular bull. A failure below 4029 could still easily be part of just a correction with the market still above former 3960-to-3980-area resistance from Feb-Mar as a new support candidate as well as 04-Mar’s 3720 next larger-degree corrective low and key long-term risk parameter.
Such commensurately larger-degree weakness below 3720 would threaten the secular bull trend to the point of even long-term institutional players and investors to hedge against potentially massive downside risk. What lies between 4029 and 3720 is anyone’s guess, keeping in mind that we cannot, for a second, RELY on former 3980-to-3960-area support to hold. In effect, the market’s downside potential below 4029 is indeterminable and, like bitcoin, potentially steep until and unless stemmed by an eventual bullish divergence in mo. Per such, even longer-term players and investors are advised to at least pare bullish exposure on a failure below 2049 to lessen the risk of loss thereafter. Because the next objective decisions making point is 04-Mar’s 3720 long-term risk parameter. If risking bullish exposure to 3720 is too great for your personal risk profile, your only objective option is to pare or neutralize exposure on a break below 4029.
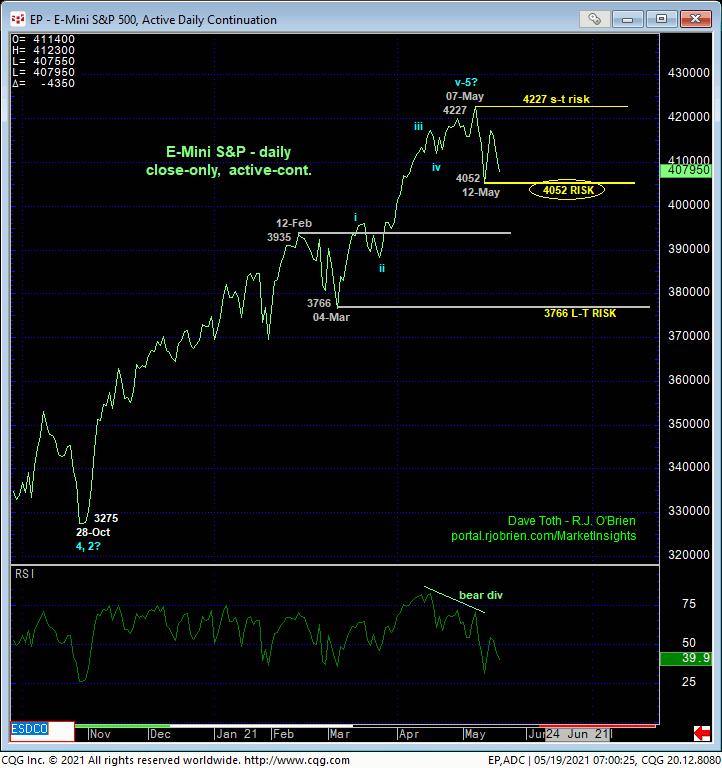
The weekly log chart below shows the magnitude of the secular bull and the difference between a failure below 4029, that would NOT allow us the conclude the bull’s end, and commensurately larger-degree weakness below 3720 that would. Again, keep the current bitcoin’s price action and vulnerability in mind when considering these two S&P risk levels as well as yesterday’s 4180 high the market needs to recoup to mitigate this downside threat.
These issues considered, shorter-term traders are advised to move to a neutral/sideline position given the market’s recent position in the middle of this month’s range where the odds of aimless whipsaw risk are approached as higher and the risk/reward metrics of initiating directional exposure are poor. A bullish policy and exposure remain advised for longer-term players, with a failure below 4029 required to defer or threaten the major bull enough to warrant at least paring, if not neutralizing bullish exposure altogether to circumvent the depths unknown of further losses thereafter. A recovery above 4180 is now crucial to a count calling this month’s chop a mere correction ahead of a resumption of the secular bull.
