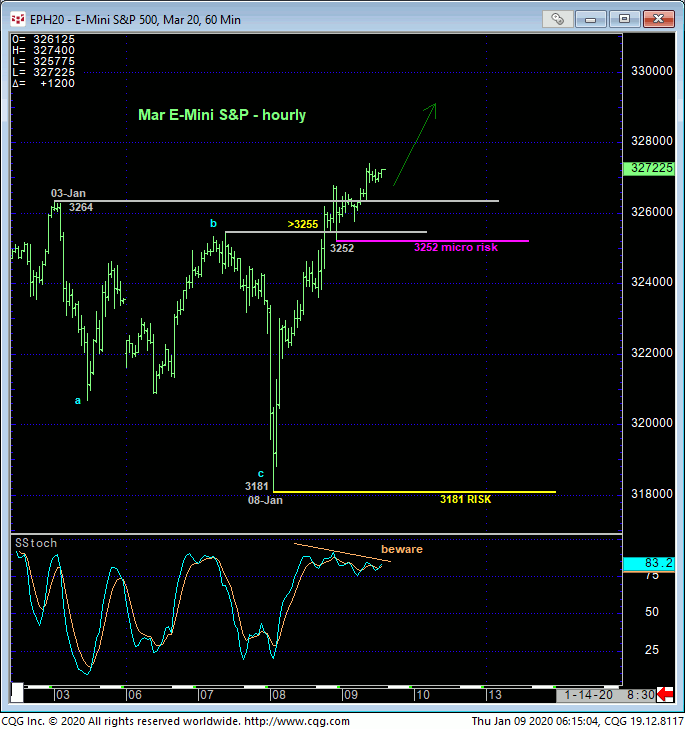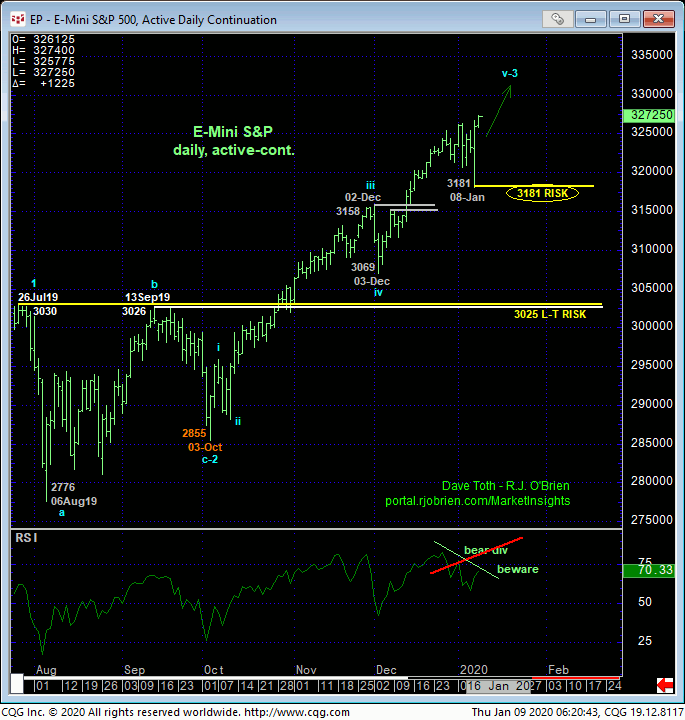

Yesterday and overnight’s recovery above 03-Jan’s 3264 high and our short-term risk parameter discussed in Tue’s Trading Strategies Blog nullifies that bearish divergence in short-term momentum and bearish scalp, confirms the sell-off attempt from 3264 to yesterday’s 3181 low as a 3-wave and thus corrective event and reinstates the secular bull trend. This resumed strength leaves yesterday’s 3181 low in its wake as a rather obvious corrective low and new key risk parameter this market is now required to fail below to confirm a bearish divergence in daily momentum and resurrect another peak/correction count. In lieu of such sub-3181 weakness, the trend is up on all scales and fully expected to continue and possibly accelerate as there are NO levels of any technical merit above the market.
As the market has reached levels where it has never ventured before, there is no resistance. The only “technical levels” that exist up here at new all-time high are those “derived” from past data points like Bollinger bands”, imokus, channel lines and even the vaunted Fibonacci progression relationships we cite often in our analysis. And no such derived level has EVER provided a reliable, objective reason to buck a clear and present trend in the absence of an accompanying confirmed bearish (in this case) divergence in momentum. And they never will as the derived level “tail” never ever wags the underlying market “dog”. Herein lies the importance of identifying corrective lows like 3181 the market is required to fail below to, in fact, break even the intermediate-term uptrend.
From a microscopic perspective relative to this secular bull market, the hourly chart above shows a very, very minor corrective low at 3252 from yesterday afternoon that serves as about as tight a short-term risk parameter as we can find. For day traders, this 3252 level suffices as a very, very tight but objective risk parameter from which a resumed bullish policy and exposure can be objectively rebased and managed.


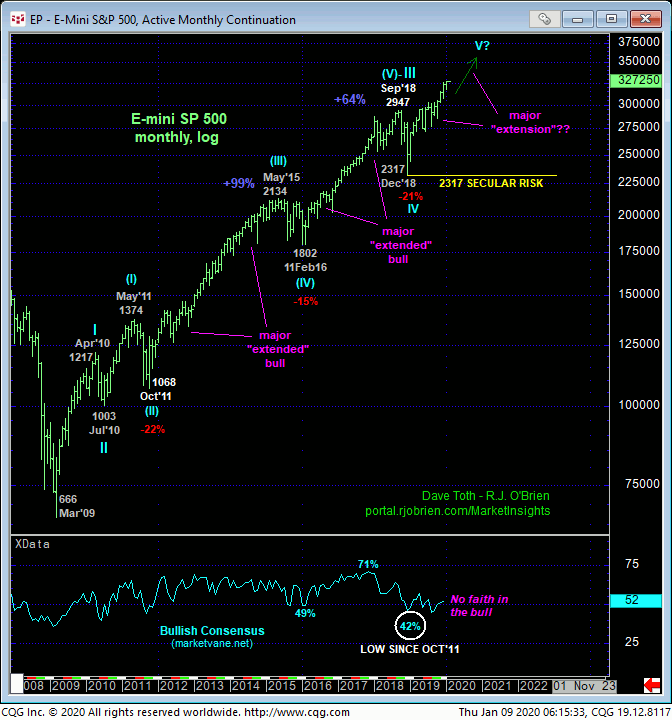
From a long-term perspective and as introduced in 11Oct19’s Technical Blog, the resumed bull trend from Dec’18’s 2317 low followed a pretty historic 21% correction that, understandably drove sentiment/contrary opinion levels to historic lows that warned of and accompanied the next great leg of the secular bull. Since prior 2015-16 and 2011 corrections of 15% and 22%, respectively, led to extraordinary gains of 64% and 99% in sustained, “extended ” resumptions of the secular bull, we discussed the prospects of another “extended” move higher from Dec’18’s 2317 low.
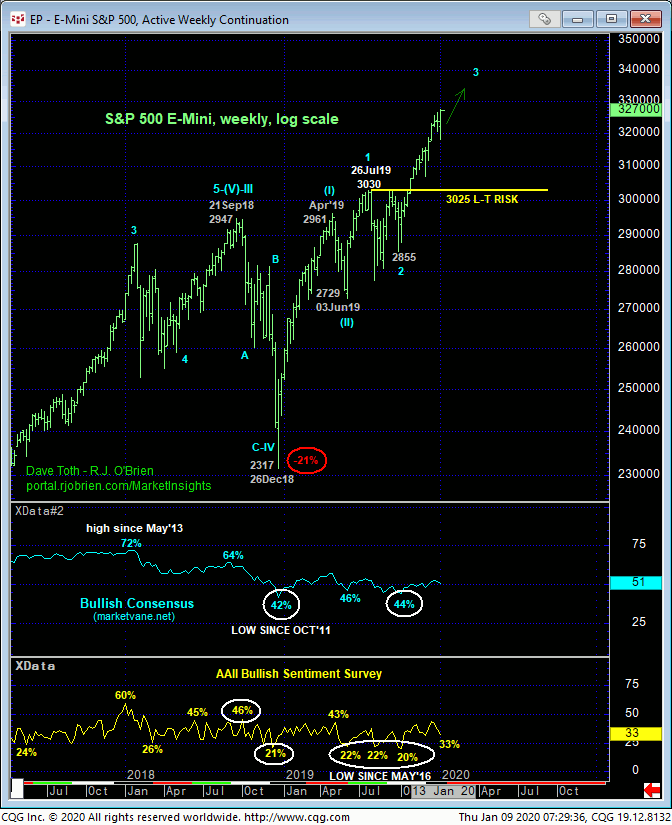
This secular bull has thus far rallied 10% from that 2317 low. To contend that it’s not on another huge, extended tangent of another 10% or 20% or 64% or 99% would be outside the bounds of technical discipline until and unless the market threatens the clear and present bull trend with specific and objective weakness below at least yesterday’s 3181 and preferably below key former resistance-turned-support from the 3025-area shown in the weekly and daily charts above. The simple fact of the technical matter is that there’s no way to know how high “high” is. But we have identified precise, objective levels the market should NOT trade below per ANY amount of upside: 3181 and 3025.
Continuing to reinforce our still-very-bullish count is the sentiment/contrary opinion fact that the huddled masses refuse to embrace the bull. Indeed, “only” a 51% reading in the Bullish Consensus (marketvane.net) and the past three weeks DECLINE to 33% in the AAII Survey continue to reflect tepid-to-bearish/confused/indifferent/fearful sentiment. Such levels would be quite OK if the market was floundering laterally-to-lower. But right into the teeth of one of the greatest bull markets in history is almost incomprehensible. And to us, we believe this warns of a vulnerability to even higher, accelerated gains.
In sum, the trend is up on al scales and is fully expected to continue and perhaps accelerate to levels indeterminately and potentially extraordinarily higher. Per such, a full and aggressive bullish policy and exposure remain advised with a failure below at least 3181 required to even defer, let alone threaten it enough to warrant defensive measures commensurate with one’s personal risk profile and investment goals. Scalpers are OK to use 3252 as a micro risk parameter.


