The market’s recovery overnight above 28-Oct’s 139.03 high and our short-term risk parameter obviously defines yesterday’s 137.20-5 low as one of developing importance and our new short-term risk parameter from which shorter-term traders with tighter risk profiles can objectively base non-bearish decisions like short-covers and cautious bullish punts. This 137.205 level is obviously THE level the market now needs to break to resurrect our major peak/reversal count. Until that low is broken, the market has reopened the question of either a more protracted corrective rebound OR a resumption of the secular bull trend.
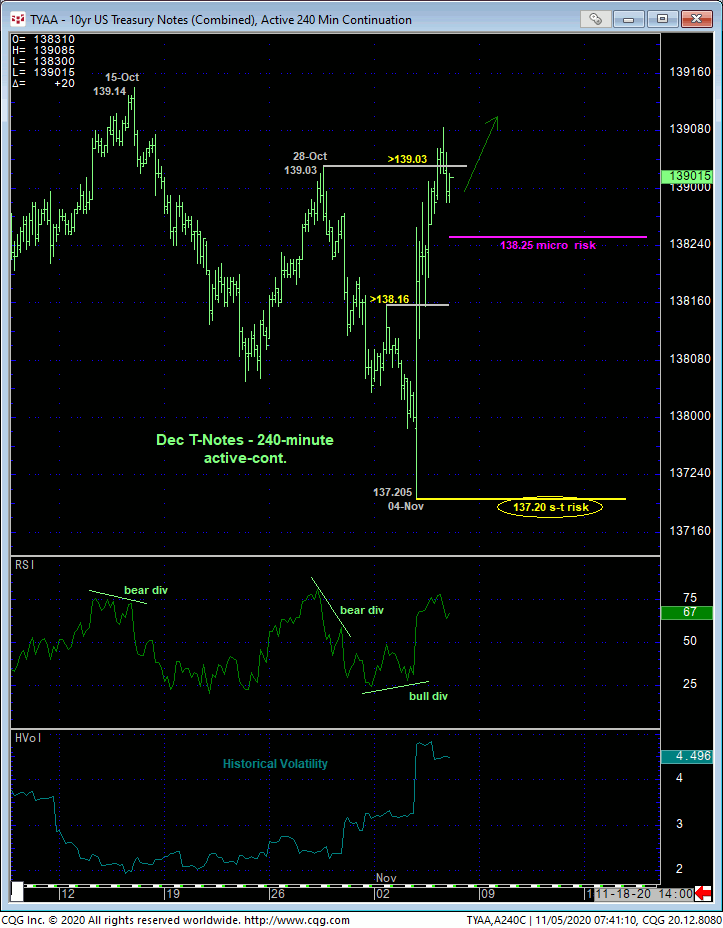
IF the market is resuming the secular bull trend after a 3-wave Aug-Nov correction, it stands to reason that it should BEHAVE LIKE A BULL by sustaining trending, impulsive, 5-wave behavior higher. The 30-min chart below delves into the finer points of this week’s recovery and shows a bearish divergence in short-term momentum. However, with former resistance-turned-support obvious around the 138.30-area, we’d require a little more significant proof of “non-strength” below a minor corrective low at 138.25. Such sub-138.25 weakness will not only break this week’s recovery attempt, it will expose it as another 3-wave and thus corrective affair as labeled. The Fibonacci fact that the resumption of this recovery from a minor corrective low at 138.155 spanned a length exactly 61.8% (i.e. 0.618 progression) of the initial 137.205 – 138.30 rally would seem to reinforce this bearish market correction count.
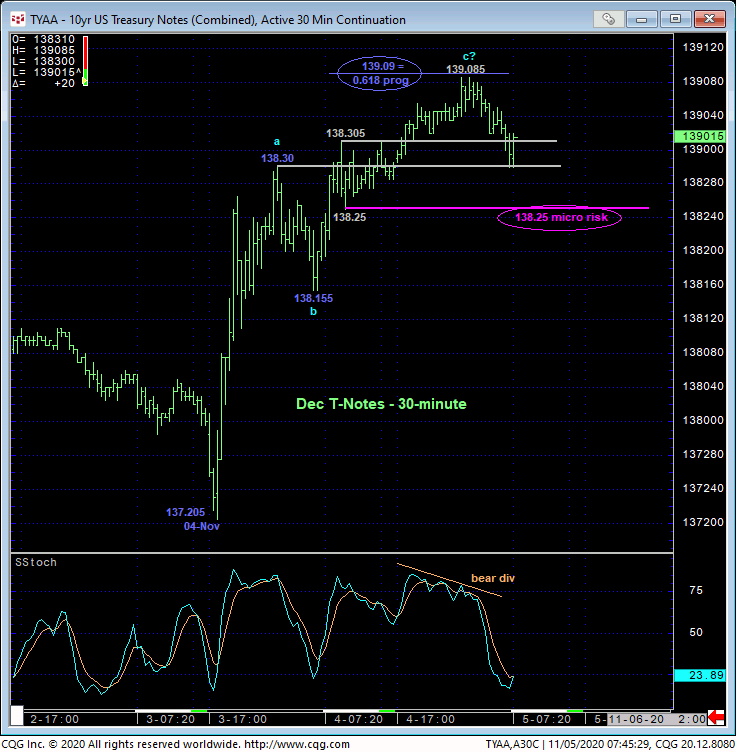
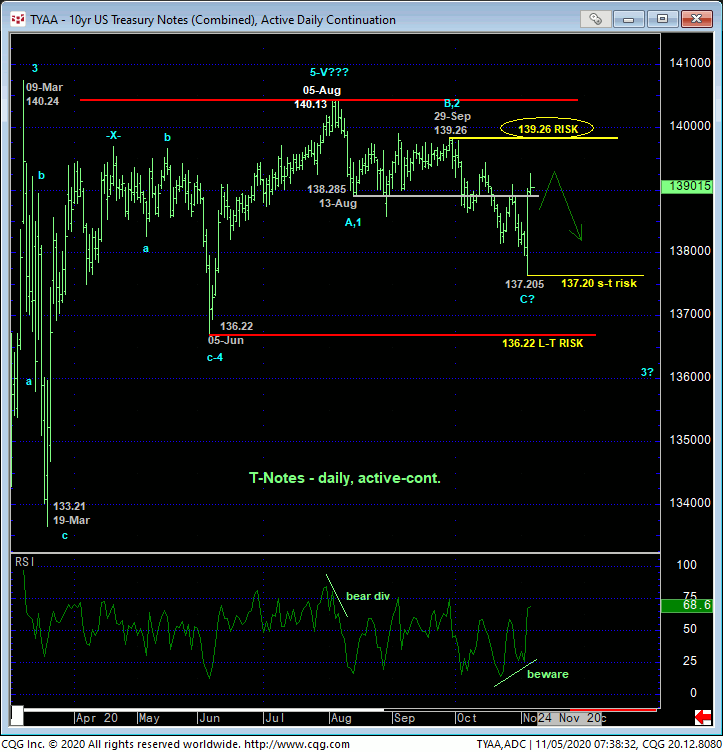
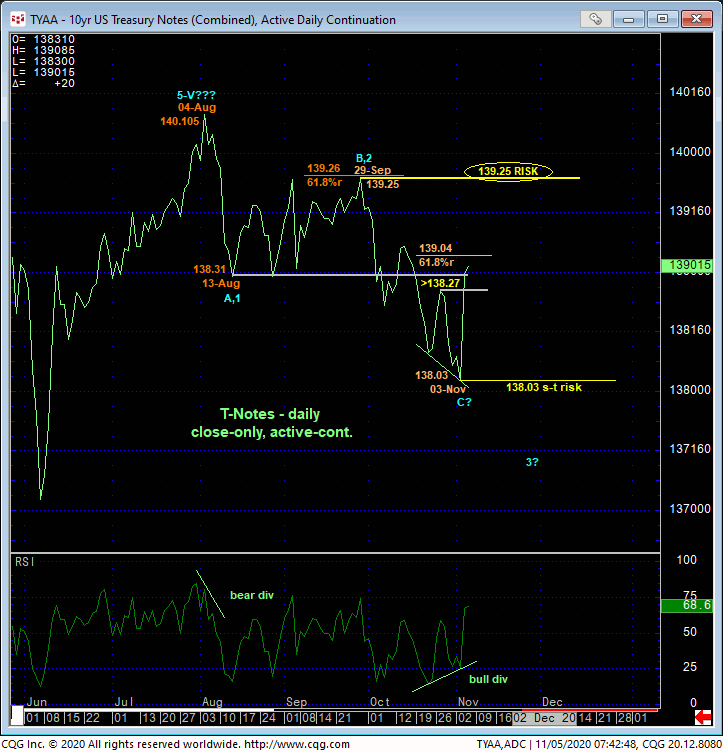
Such confirmed proof of shorter-term weakness below an admittedly very minor corrective low and micro risk parameter at 138.25 would be important given that we’ve identified the 139-to-139-1/4-area as a key former support area from mid-Aug until late-Oct’s breakdown that then left it as a new key resistance candidate. The daily bar chart above and close-only chart below show the market’s engagement of this resistance candidate.
The intermediate-term trend is up and should not be underestimated until and unless the market provides evidence to contest it. A short-term failure below 138.25 will contest it and resurrect the prospects for our broader peak/reversal count.
It’s also worth noting that on a longer-term scale, commensurately larger-degree strength above 29-Se’s 139.26 larger-degree corrective high and key risk parameter remains required to negate our major peak/reversal count. Overnight’s recovery does confirm a bullish divergence in daily momentum. But against the backdrop of THREE MONTHS of peak/reversal-threat behavior, this recovery is NOT of a scale sufficient to negate our broader bearish count and confirm the secular bull market’s resumption.
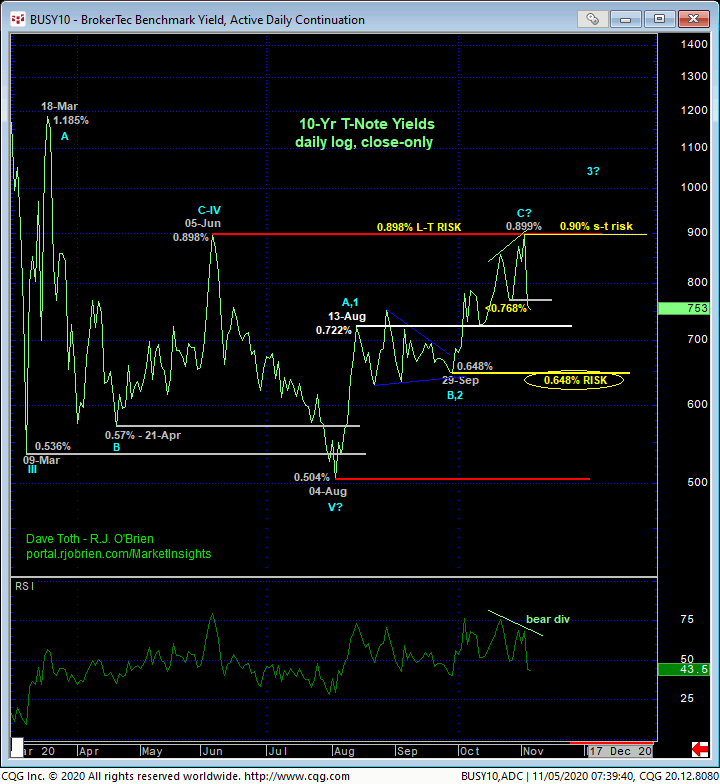
ON a 10-yr yield basis, the daily log close-only chart below shows yesterday’s bearish divergence in momentum that defines Tue’s 0.899% high as one of developing importance and THE rate level this market needs to recoup to resurrect our major base/reversal count. This chart also shows however that the market remains above a goodly amount of former rate action around the 0.722%-area that, since broken in early-Oct, remains a key support candidate that we would expect to hold per our major base/reversal count. Commensurately larger-degree weakness below 29-Sep’s 0.648% larger-degree corrective low remains required to render Aug-Nov’s recovery attempt a 3-wave and thus corrective affair that would then re-expose the secular bear trend in rates.
These issues considered, a bearish policy and exposure remain advised for long-term players with a recovery above 139.29 required to negate this call and warrant its cover. Shorter-term traders have been advised to neutralize their bearish exposure. However, we believe a relapse below 138.25 will not only arrest this week’s rebound, but also present a favorable risk/reward opportunity from which to re-establish a bearish policy and exposure with a subsequent recovery above whatever high is left in the wake of such a sub-138.25 failure (139.085 currently). In effect and while not disputing the importance of yesterday’s 137.205 low, we believe the market has identified 139.29 and 138.25 as the key directional flexion points heading forward.
