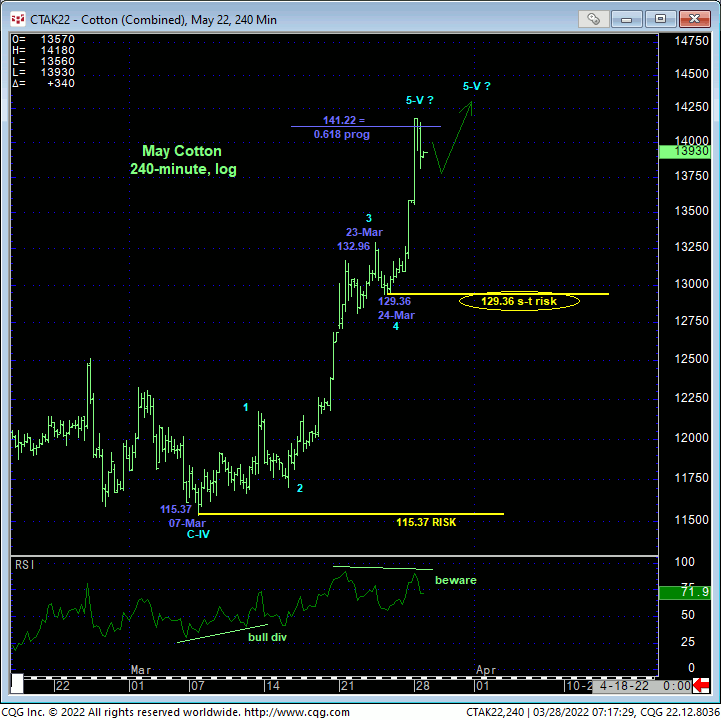
Fri and overnight’s continued, accelerated continuation of the secular bull market leaves Thur’s 129.36 low in its wake as the latest smaller-degree corrective low this market is now minimally required to fail below to break even the portion of the major bull from 07-Mar’s 115.37 next larger-degree corrective low, let alone threaten the secular bull trend. Per such, this 129.36 level is considered our new short-term risk parameter from which shorter-term traders with tighter risk profiles can objectively rebase and manage the risk of a still-advised bullish policy and exposure.
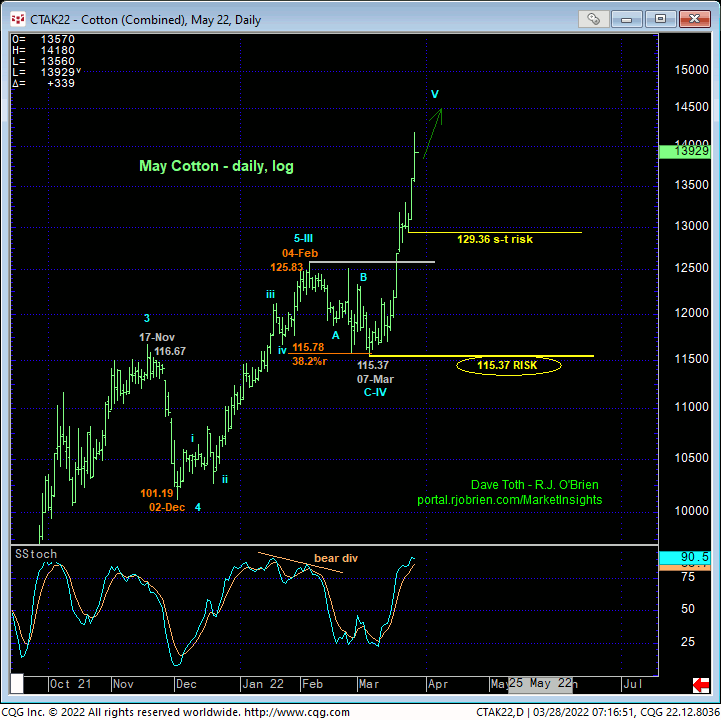
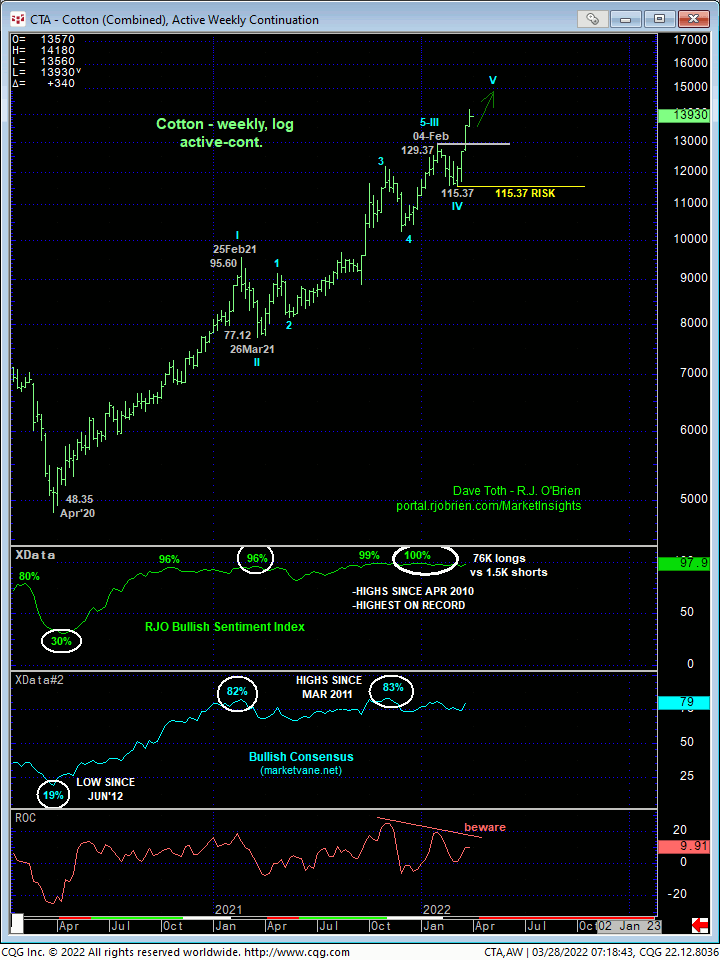
On a broader scale, the dominance of the secular bull trend remains obvious in the daily (above) and weekly (below) log scale charts with a failure below 07-Mar’s 115.37 corrective low clearly required to break the major bull trend. Per such, this 115.37 level remains intact as our key long-term bull risk parameter pertinent to longer-term commercial players. Former 125-handle-area resistance, since obliterated early last week, is considered new near-term support this market is required to break to even get a shot at 115.37.
As we’ve discussed for weeks if not months, market sentiment/contrary opinion levels remain in the stratosphere and are typical of major peak/reversal environments. But we remind traders that contrary opinion is not an applicable technical tool in the absence of an accompanying confirmed bearish divergence in momentum needed to, in fact, break the clear and present uptrend. Herein lies the importance of corrective lows and risk parameters like we’ve identified above, even admittedly smaller-degree ones like 129.36.
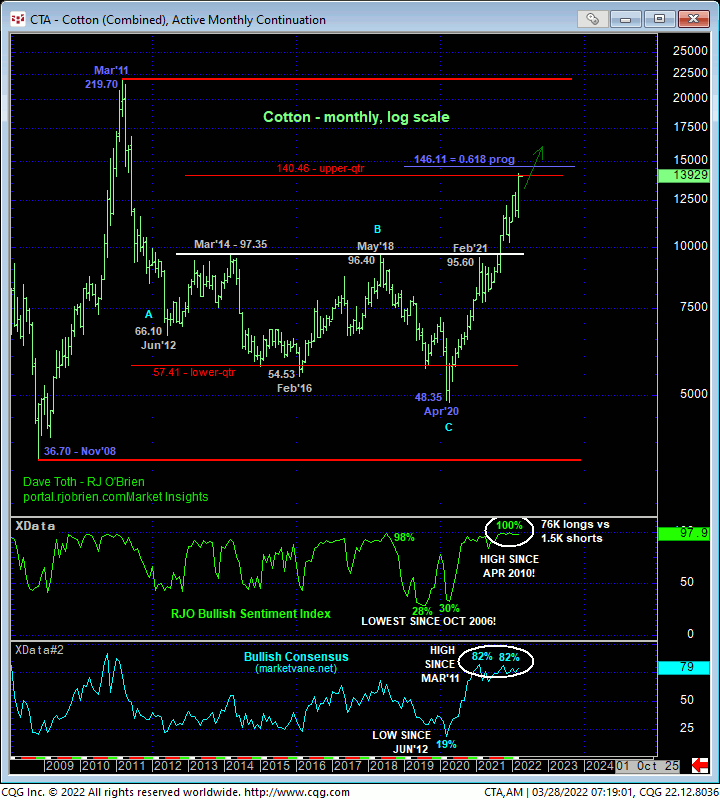
Finally, the monthly log chart below shows the market engaging the upper-quarter of its massive historical range where we’ll keep a keen eye on MOMENTUM and the bearish divergence required to threaten this clear and present bull and expose an opportunity from the bear side that may be major in scope. This chart also shows the market closing in on the 146.11 area that is the 0.618 progression of 2008 – 2011’s previous major bull trend from 36.70 – to 219.70 taken from Apr’20’s 48.35 low. We would remind traders that merely derived technical levels are useless in the absence of an accompanying confirmed bearish (in this case) divergence in momentum.
In sum, the trend remains up on all scales and should hardly surprise by its continuance or acceleration, with a failure below 129.36 minimally required for shorter-term traders to move to the sidelines and perhaps for even longer-term commercial players to pare exposure to more conservative levels.