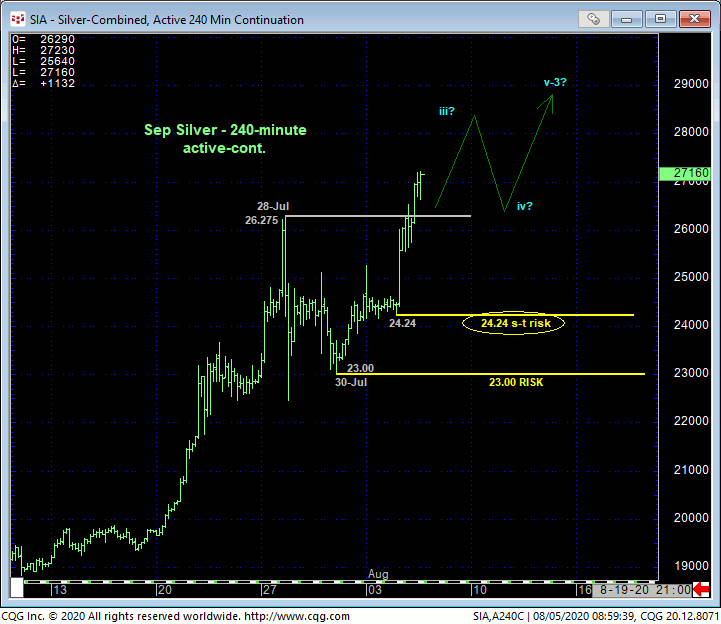
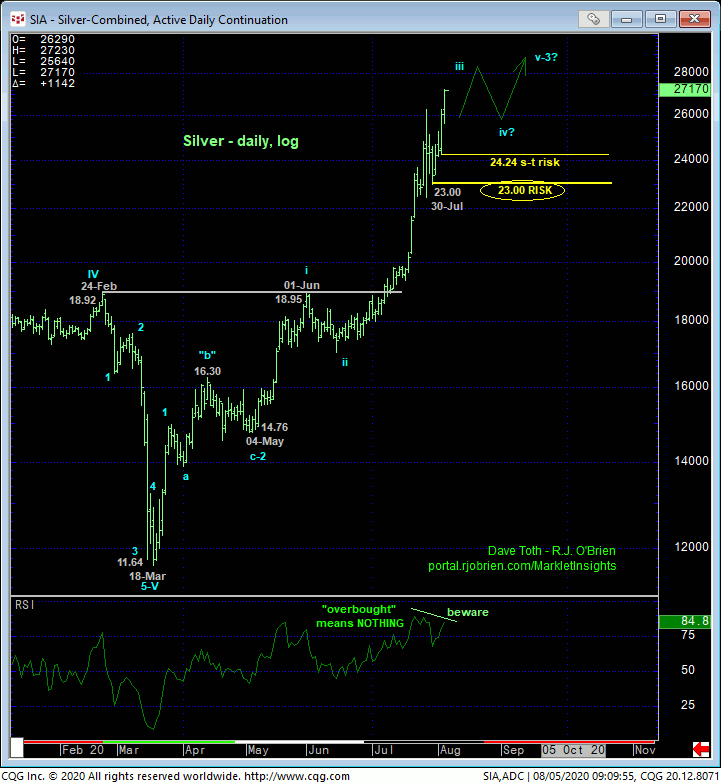
The 240-min chart above and daily log scale chart below show overnight’s break above last week’s 26.275 high that reaffirms and reinstates the secular bull trend and leaves smaller- and larger-degree corrective lows in its wake at 24.24 and 23.00, respectively, that the market is now required to fail below to even defer, let alone threaten a bullish count and policy. Per such, these levels serve as our new short- and longer-term risk parameters from which a still-advised bullish policy and exposure can be objectively rebased and managed.
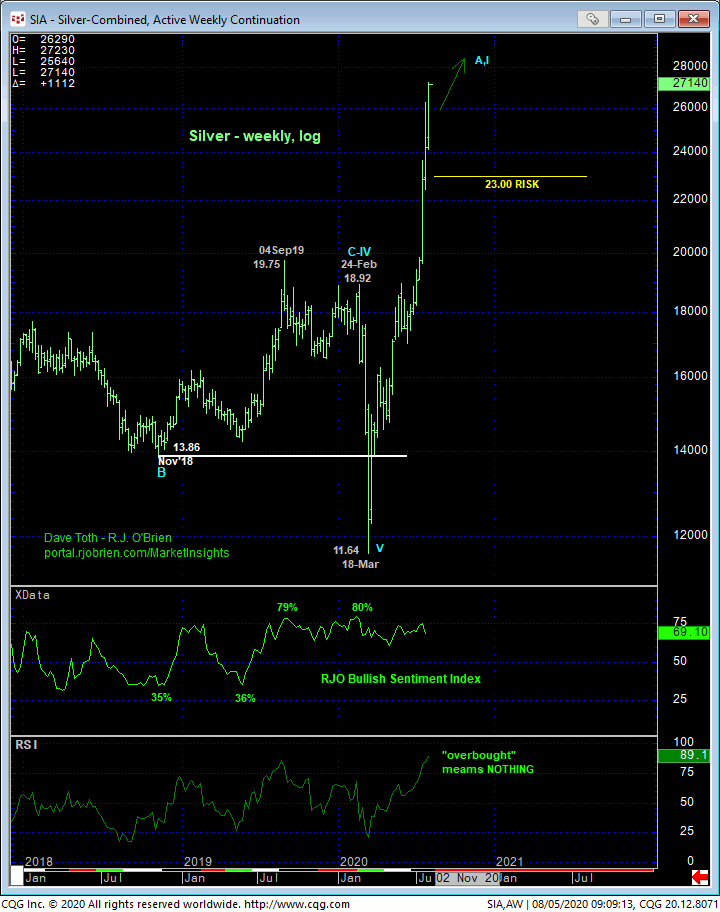
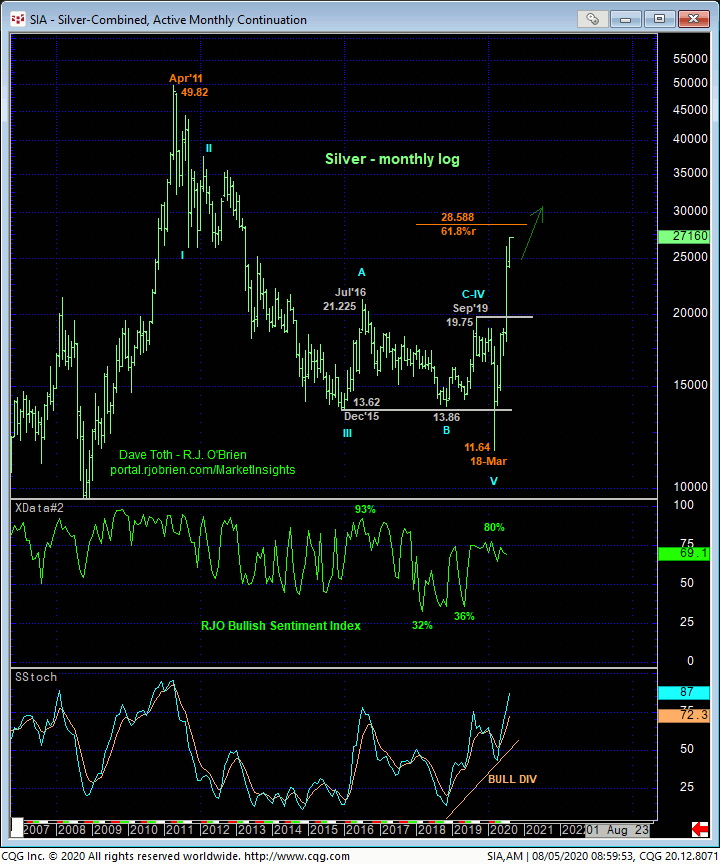
With today’s resumed bull in mind on a shorter-term basis discussed above, the trend is up on all scales when you jump back to a long-term perspective shown in the weekly (above) and monthly (below) log scale charts. Indeed, the market has exposed a vast chasm totally devoid of any technical levels of merit shy of Apr’11’s 49.82 all-time high. This does not mean we’re forecasting a move to 49.82. But it certainly does mean that until and unless the market fails below the corrective lows and risk parameters specified above, the market’s upside potential is indeterminable and potentially severe, including a run at 49.82. In effect, there is no resistance. The only technical levels of any merit exist only below the market in the form of prior corrective lows like 24.24 and 23.00.
The weekly chart above is also the poster child for total irrelevance of a market being considered “overbought” merely because an indicator like the RSI- DERIVED FROM underlying prices- has reached some preordained “high” level like 80%. There remains an abundant use of this term in the futures industry and it remains as wrong and ill-advised as it ever was as the derived indicator “tail” never, ever wags the underlying market “dog”.
These issues considered, a full and aggressive bullish policy and exposure remain advised with a failure below 24.24 required for shorter-term traders to move to a neutral/sideline position and for longer-term players to pare exposure to more conservative levels. In lieu of such weakness, further and possibly accelerated gains remain expected.
DEC GOLD
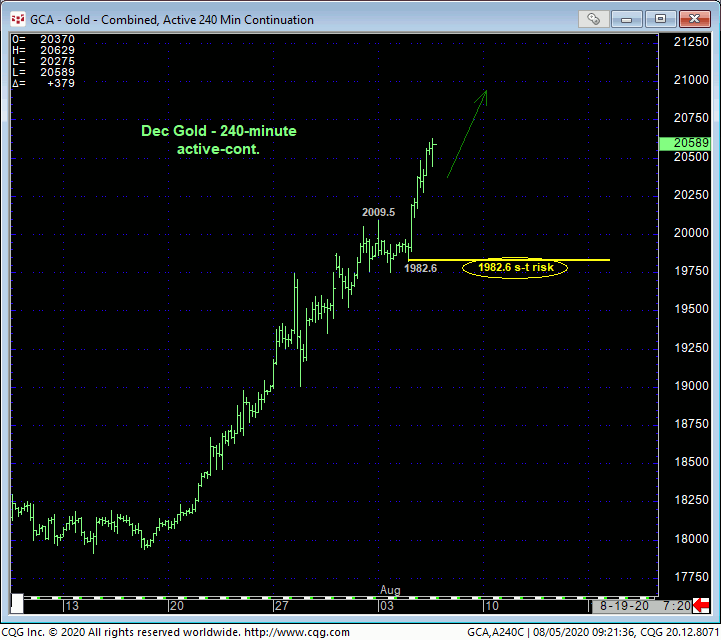
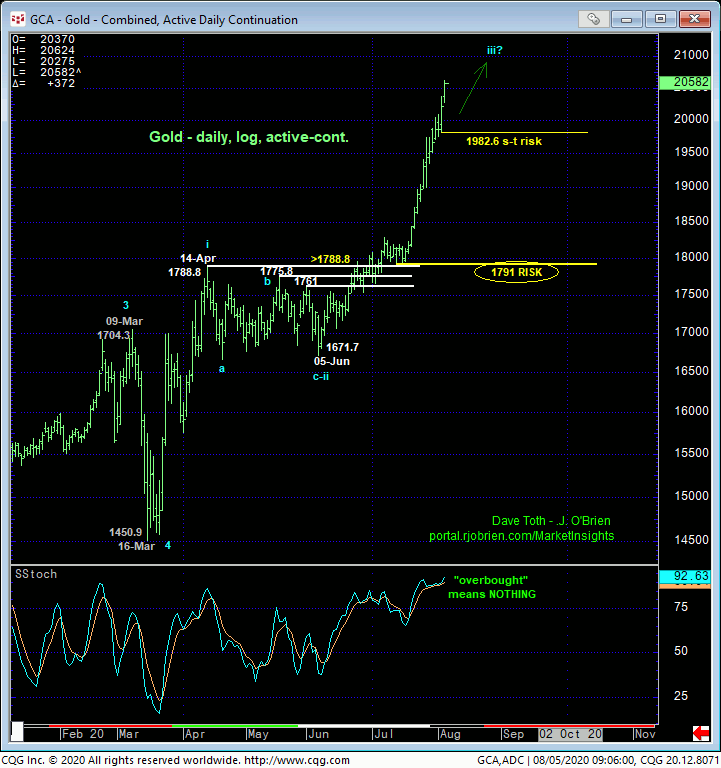
The gold trend remains up on all scales, so little has changed from our last update in 28-Jul’s Technical Blog. But similar to the shorter-term analysis in silver above, the 240-min chart above shows this week’s continuation of the bull following a very minor corrective hiccup down yesterday’s 1982.6 low that the market is now minimally required to fail below to confirm a bearish divergence in very short-term momentum needed to defer the bull and expose an interim correction. As the steep, uninterrupted nature of this bull could easily result in a relatively steep correction the momentum that market fails to sustain its simple uptrend pattern of higher highs and higher lows on even a short-term basis, shorter-term traders with tighter risk profiles are advised to use 1982.6 as our new short-term risk parameter from which a still-advised bullish policy can be objectively rebased and managed. Until such sub-1982.6 weakness is proven, the trend remains up on all scales and should not surprise by its continuance or acceleration.
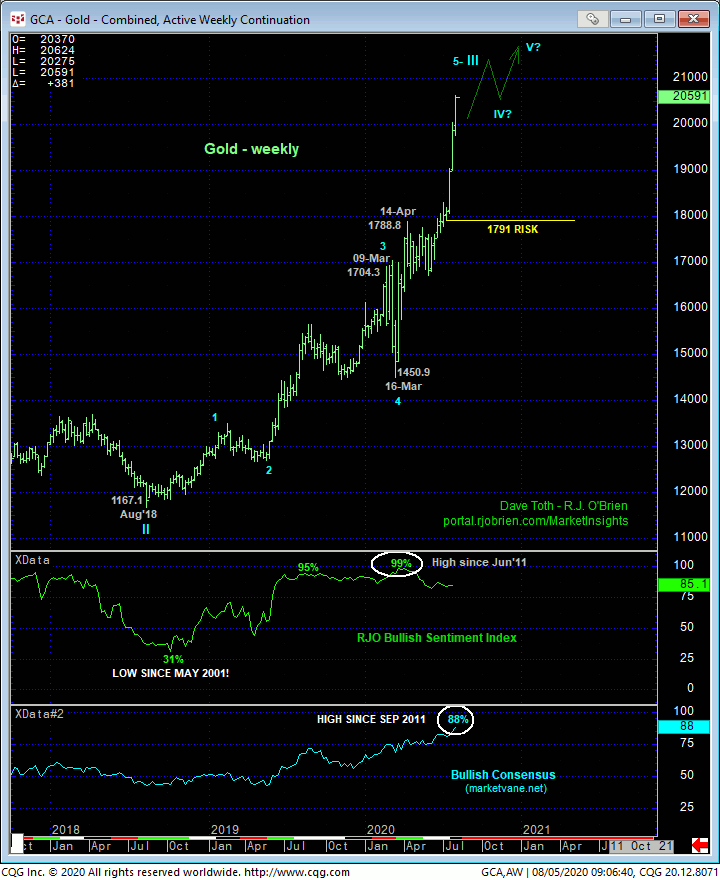
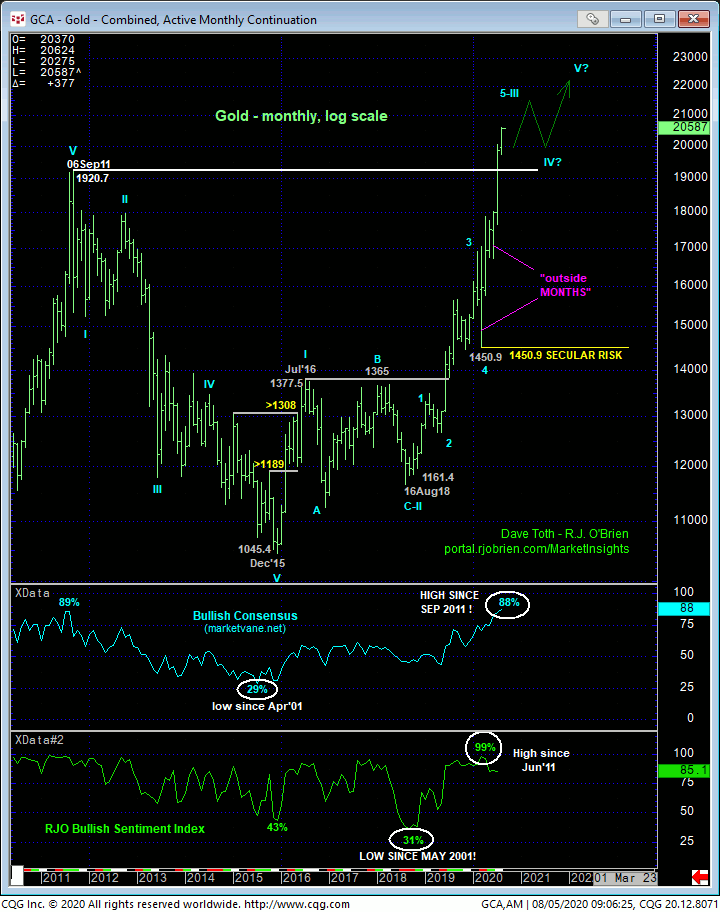
The weekly (above) and monthly (below) charts show the secular bull trend’s break to new all-time highs above Sep’11’s 1920 high that, understandably, comes with historically frothy sentiment levels typical of major PEAK/reversal environments. But traders are reminded that sentiment/contrary opinion is not an APPLICABLE technical tool in the absence of an accompanying confirmed bearish divergence in momentum needed to, in fact, at least stem the clear and present uptrend. Herein lies the importance of corrective lows and risk parameters like even a very tight corrective low like 1982.6.
These issues considered, a bullish policy and exposure remain advised with a failure below 1982.6 minimally required for shorter-term traders to move to the sidelines and perhaps for even long-term players to pare bullish exposure in the interest of exchanging whipsaw risk (above whatever high is rejected/defined) for larger nominal risk lower. In lieu of at least such sub-1982.6 weakness, the market’s upside potential remains indeterminable and potentially extreme.
