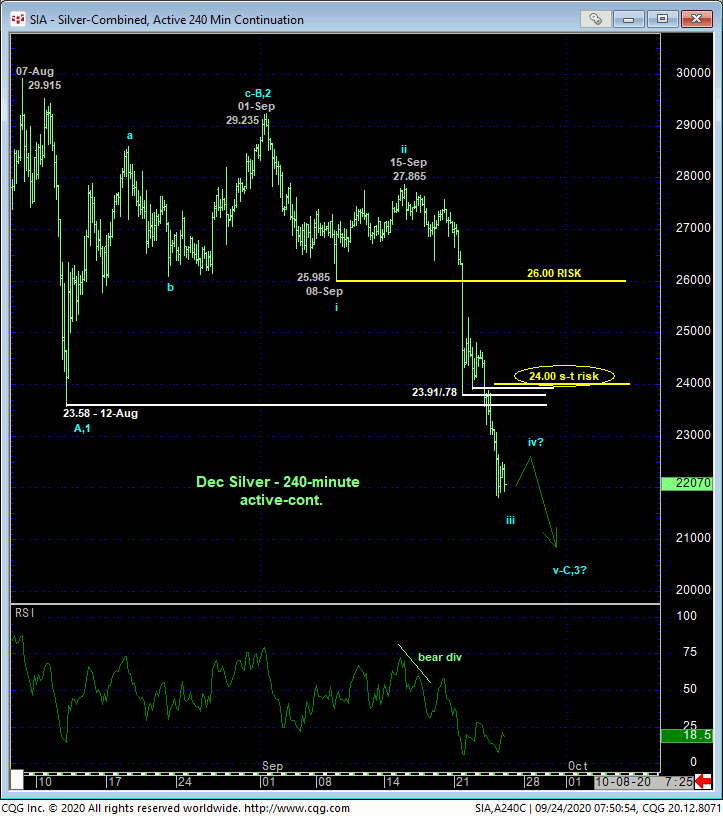
The extent and impulsiveness of yesterday and today’s clear break below 12-Aug’s 23.58 low and our key risk parameter confirms a bearish divergence in WEEKLY momentum, breaks this year’s major uptrend and exposes a correction or reversal lower that could be major in scope. The 240-min chart below details this latest spate of weakness following 17-Sep’s bearish divergence in short-term momentum discussed in that day’s Technical Webcast that leaves key former support from the 23.91-to-23.58-area in its wake that, since demolished, is now considered new resistance that that market should not be able to recoup per any broader bearish count. Per such, we are defining 24.00 as our new short-term risk parameter from which a bearish policy and exposure can be objectively rebased and managed by shorter-term traders with tighter risk profiles.

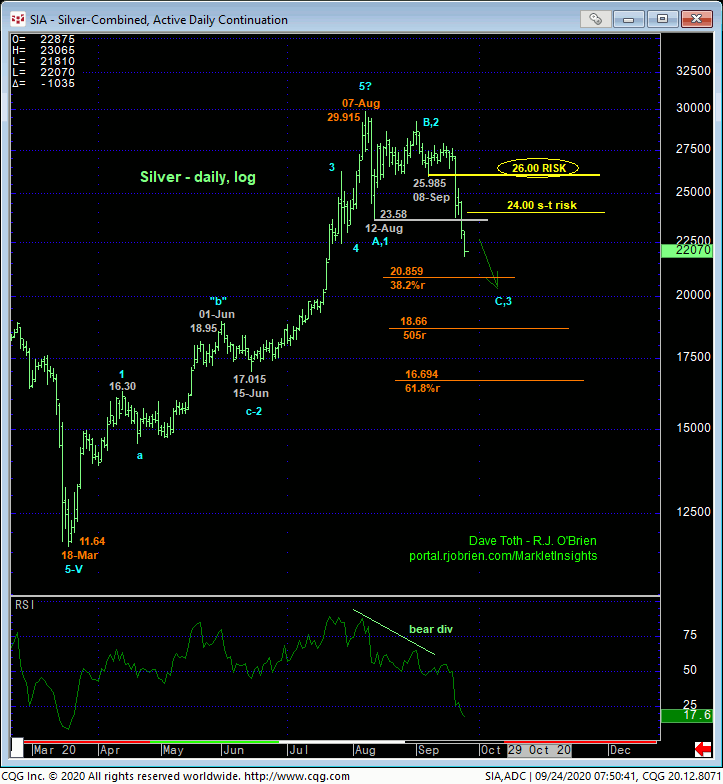
This intra-day chart above and daily chart below also show 08-Sep’s 25.985 low as the minor 1st-Wave of the (C- or 3rd-Wave) decline from 01-Sep’s 29.235 high. The decline from that 29.235 high can only be one of two things: the completing C-Wave of a major bull market correction or the dramatic 3rd-Wave of a major reversal lower. As the trend is now clearly down on all practical scales, are bias is WITH this trend and for a major 3rd-Wave down. Under such a count, this market shouldn’t come anywhere near this 26.00-area threshold, let alone recover above it. Indeed, it should continued to get punished straight away in an increasingly obvious manner. A recovery above 26.00 would negate this longer-term bearish count, render the sell-off attempt from 07-Aug’s 29.915 high a 3-wave and thus corrective affair and re-expose the major bull. Per such, we’re defining 26.00 as our new key long-term risk parameter from which long-term players can now objectively base and manage the risk of a new bearish policy.

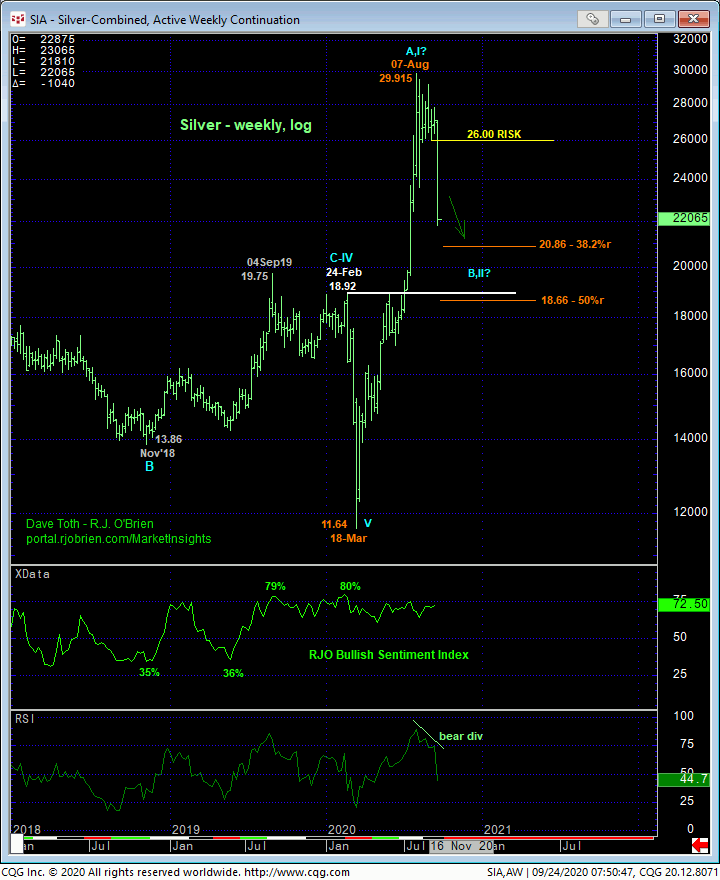
Only a glance at the daily log chart above and weekly log chart below is needed to see that the market has sold off enough over the past two days to break this year’s entire uptrend from 11.64 to 29.915. As reference points (these are NOT support), the 38.2% and 50% retraces of this year’s rally cut across at 20.86 and 18.66, respectively. The weekly chart also shows the 19-handle as a key area of former resistance that, since demolished by Jul’s price explosion, now must be considered a support candidate. In terms of downside potential then, there’s no reason not to think this market couldn’t continue to erode to the general 19-handle-area.
Regardless however, ONLY a confirmed bullish divergence in momentum will suffice in identifying any specific low or support from which non-bearish decisions can then be objectively based and managed. And currently, there’s no threat of this shy of even a short-term recovery above 24.00.

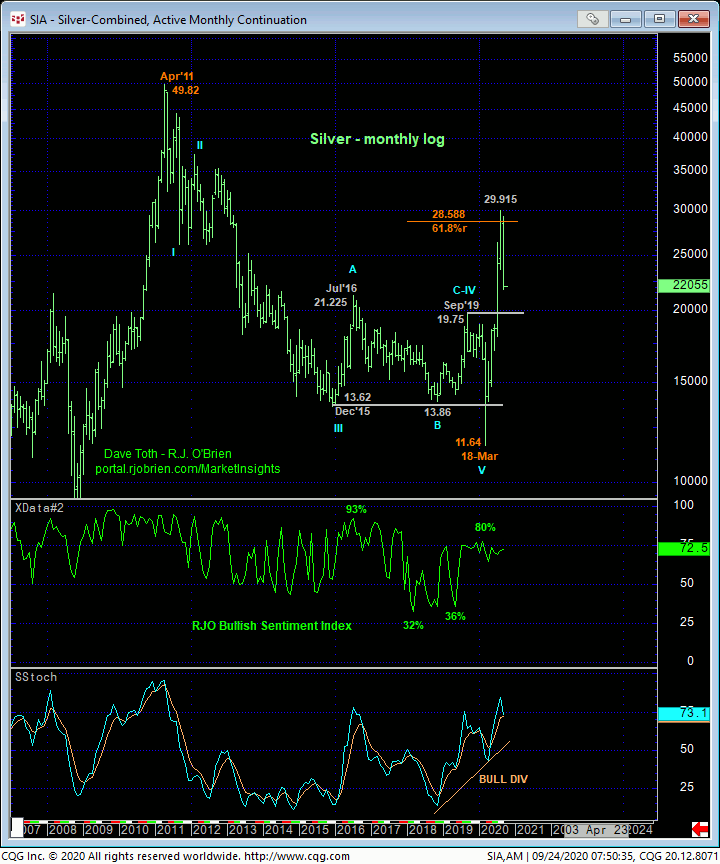
On an even broader scale, the monthly log scale chart below shows the general $20-handle-area as former key resistance from Jul’16 until this year’s bust-out above it. This fact reinforces the 19-to-20-handle-area as a support candidate. But again, only a confirmed bullish divergence in momentum will suffice in threatening or stemming the clear and present downtrend. Until and unless such a divergence rejects/defines some semblance of support or a low, the market’s downside potential should be considered indeterminable and potentially extreme.
In sum, a bearish policy and exposure are advised with a recovery above at least 24.00 required to threaten this call and warrant defensive measures. In lieu of such 24.00+ strength, further and possibly accelerated losses should not surprise. Former 23.50-to-24.00-area support is considered new near-term resistance.


