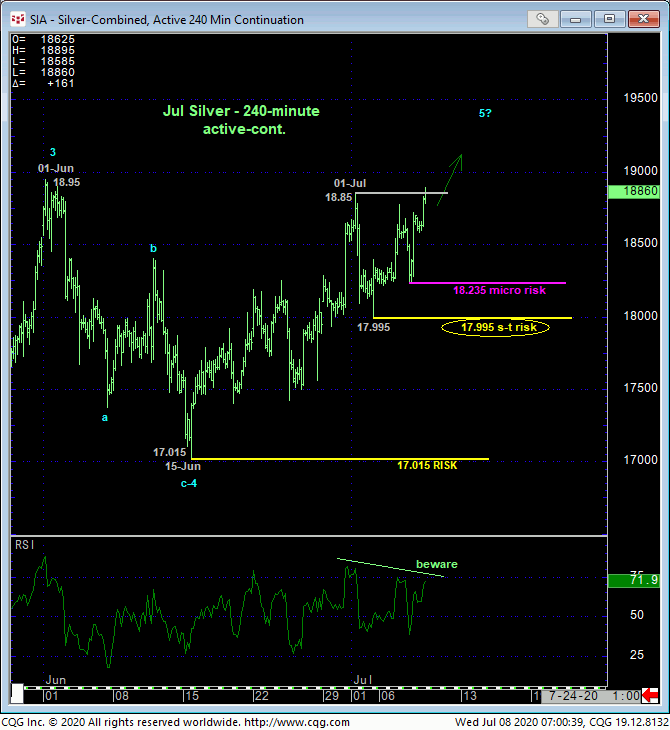
Overnight’s break above last week’s 18.85 high reaffirms the latest developing uptrend from 15-Jun’s 17.015 low and leaves 02-Jul’s 17.995 low in its wake as the latest smaller-degree corrective low the market is now required to fail below to break Jun-Jul’s portion of this year’s major reversal and perpetuate further lateral consolidation or possibly a peak/reversal process. Until and unless such sub-17.995 weakness is proven and continuing to bias WITH the longer-term uptrend, we anticipate an upside breakout above this year’s 24-Feb high at 18.92 ahead of potentially extreme gains thereafter. Per such, this 17.995 low is considered our new short-term risk parameter from which shorter-term traders can objectively rebase and manage the risk of a still-advised bullish policy.
Yesterday’s 18.235 even smaller-degree corrective low is also left in the wake of today’s resumption of the 3-week rally and may be used as a micro risk parameter that exchanges whipsaw risk for deeper nominal risk to 17.995.
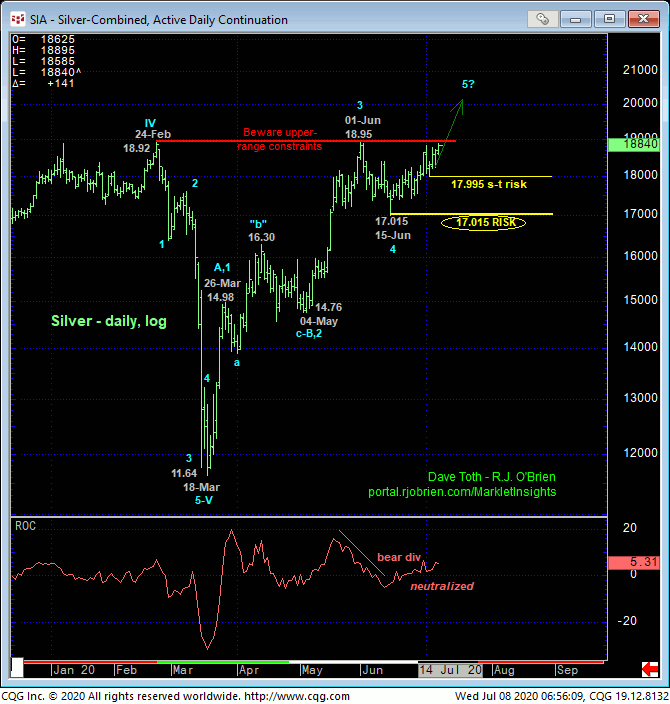
The daily log scale chart above shows the pertinence of the 18.92-to-18.95-area that has thus far capped this year’s price action as key resistance. A break above this area would be expected to be followed by sustained, trendy, impulsive gains thereafter IF this market has something more bullish in store for us that would continue to warrant a bullish policy. A minor “breakout” above this area and subsequent relapse below corrective lows like 17.995 and certainly 15-Jun’s 17.015 next larger-degree corrective low and key risk parameter would NOT be expected per any broader bullish count and would warrant paring and then neutralizing altogether bullish exposure.
The risk of a continued bullish policy and exposure has been identified and is specific. What’s a total unknown is the extent of the bull’s plans. And they should not be underestimated until and unless the market confirms a momentum failure needed to, in fact, break the clear and present uptrend. And we know precisely where that’s the case: 17.015.
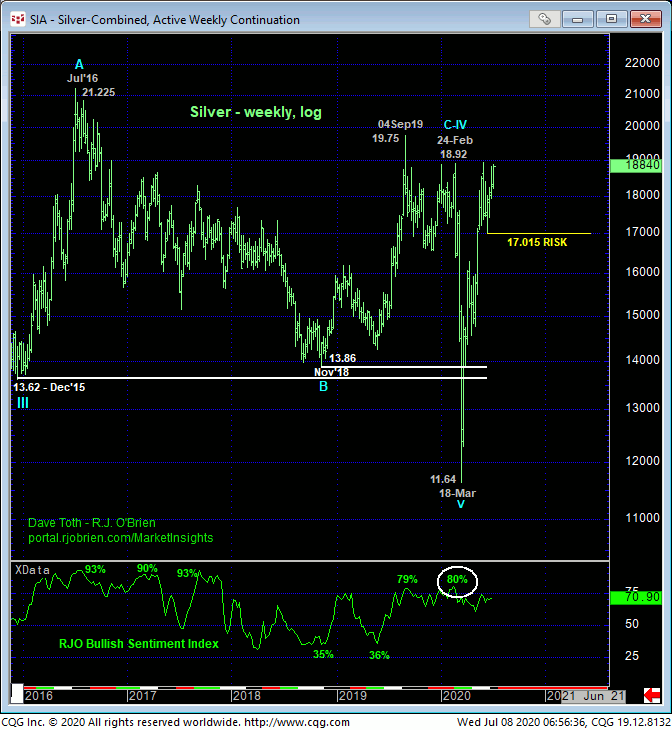
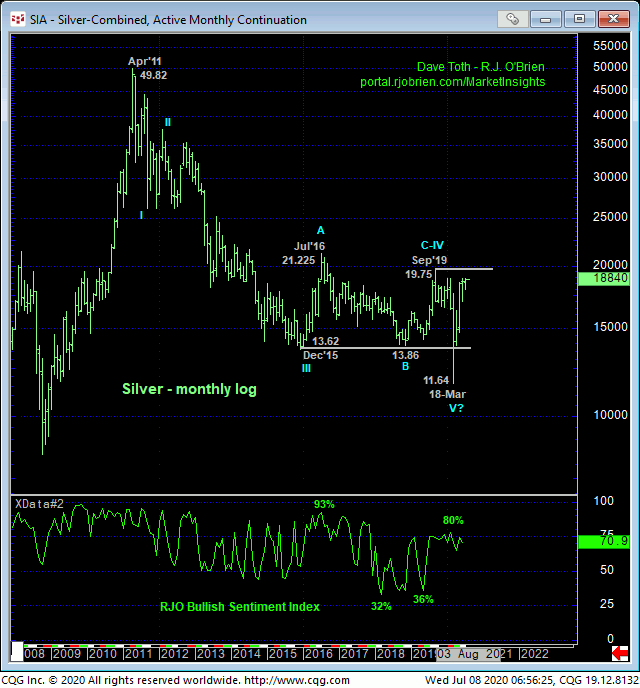
On a longer-term basis, the weekly chart above and monthly chart below show NO levels of any technical merit between the 18.95 level discussed above and Sep’19’s 19.75 high, so that level would be the next pertinent threshold above 18.95. And above 19.75 lies Jul’16’s relatively neighborly 21.225 high that defines the upper boundary of resistance that has capped this market for the past FOUR YEARS. Along with understandably historically frothy bullish sentiment typical of major peak/reversal environments, it’s not hard to find factors that suggest the risk/reward merits of a continued bullish policy are questionable “up here”. But if they are, a confirmed momentum failure will tell us so and we’ll act accordingly. Until such a mo failure breaks the bull, the trend should not surprise by its continuance or acceleration as it’s likewise not hard to speculate that continued quality-flight bids to gold and Treasuries and an arguably teetering equities market could lead to accelerated gains in silver.
In sum, a bullish policy remains advised with a failure below 17.995 required for shorter-term traders to step aside and commensurately larger-degree weakness below 17.015 required for long-term players to take similar defensive measures. In lieu of such weakness, further and possibly accelerated gains remain expected.