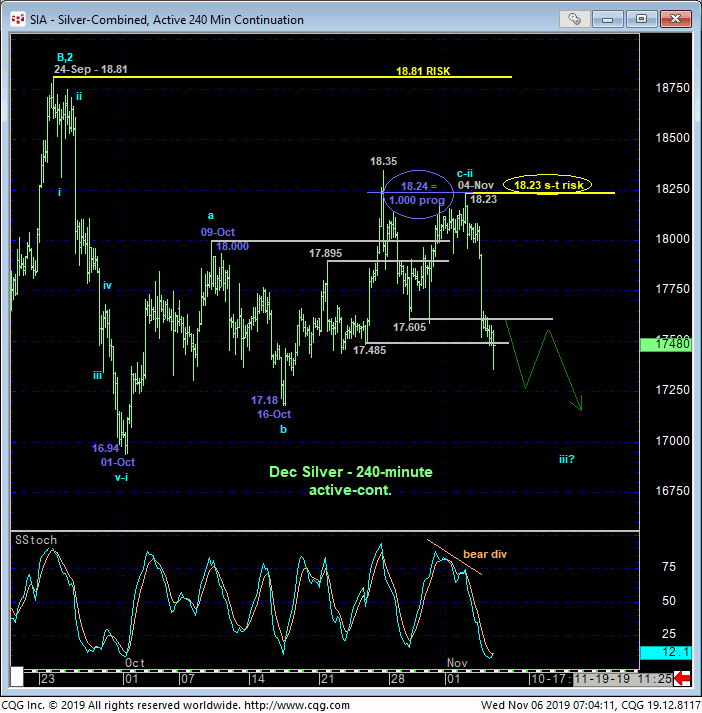
DEC SILVER
The extent and impulsiveness of yesterday’s relapse below 29-Oct’s 17.605 low not only confirms a bearish divergence in momentum, it renders the recovery attempt from 01-Oct’s 16.94 low to Mon’s 18.23 high a 3-wave structure as labeled in the 240-min chart below. Left unaltered by a recovery above Mon’s 18.23 high that now serves as our new short-term risk parameter, this full month, 3-wave recovery is considered a corrective/consolidative event that warns of a resumption of Sep’s downtrend that preceded it.
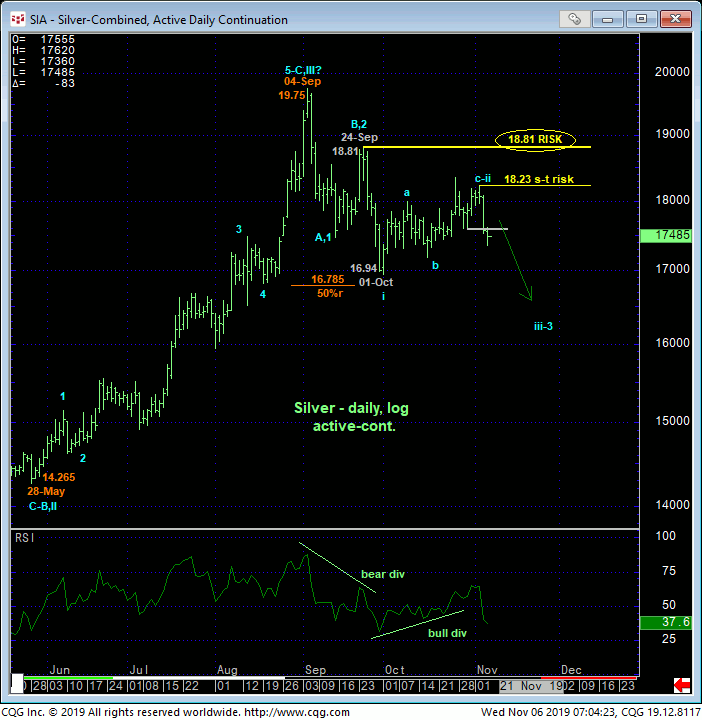
The daily log chart above shows the labeled, 3-wave, bear-flag nature of the past month’s recovery attempt that resurrects our broader peak/reversal count introduced in 27-Sep’s Technical Blog. This count remains predicated on:
- 27-Sep’s bearish divergence in momentum that breaks May-Sep’s uptrend
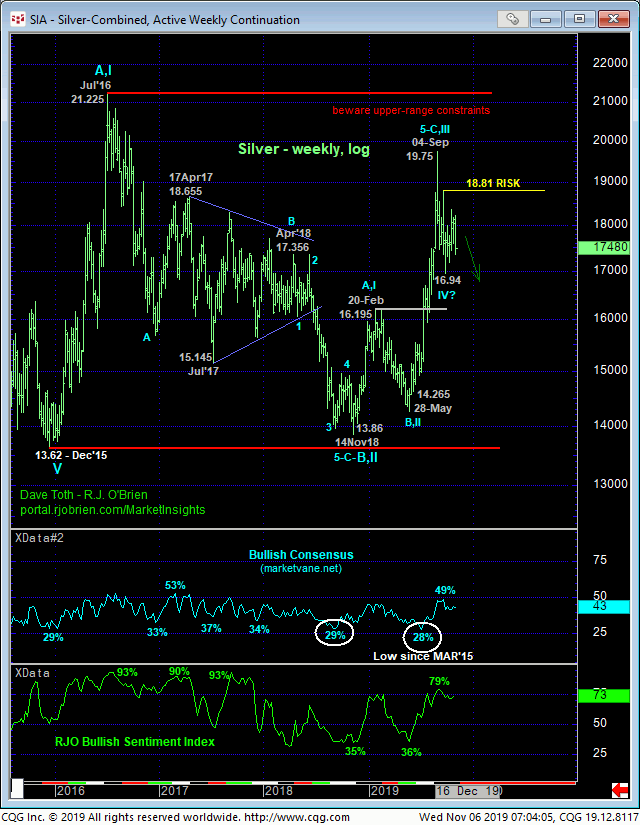
- the market’s rejection thus far of the upper-quarter of the 3-year range (shown in the weekly log chart further below) amidst
- historically bullish sentiment levels.
The Fibonacci fact that Oct’s recovery attempt stalled just a penny away from the (18.057) 61.8% retrace of late-Sep’s preceding 18.711 – 16.998 break would seem to reinforce this bearish count.
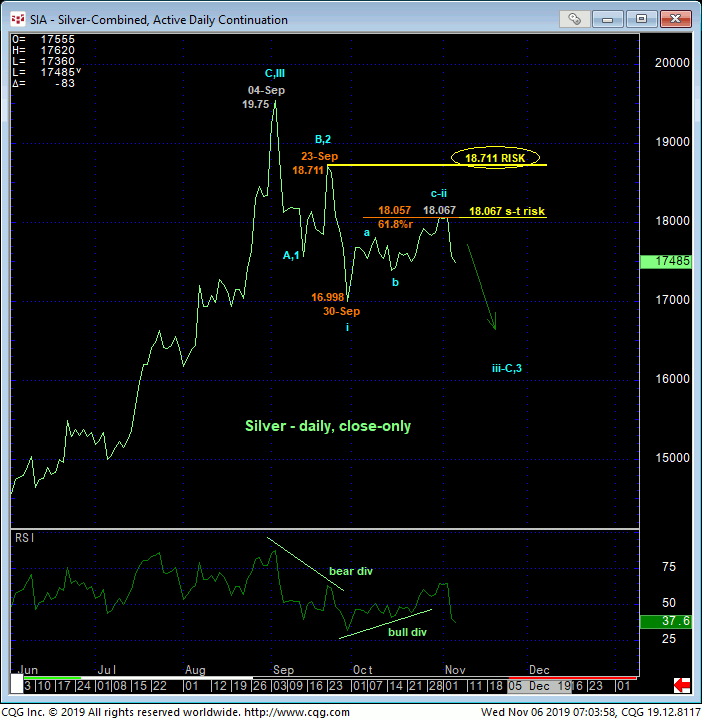
The weekly log chart below shows the market’s rejection thus far of the upper-quarter of the 3-1/2-year range amidst historically bullish sentiment levels typical of broader peak/reversal-threat conditions. These issues considered, a bearish policy remains advised for long-term players with a recovery above 18.23 required to threaten this cal enough to warrant its cover. Shorter-term traders with tighter risk profiles are advised t first approach intra-range recovery attempts to 17.75 OB as corrective selling opportunities with a recovery above 18.23 negating this cal and warranting its cover. In lieu of such 18.23+ strength, we anticipate a resumption of Sep’s downtrend to levels potentially well below 01-Oct’s 16.94 low.
DEC COPPER
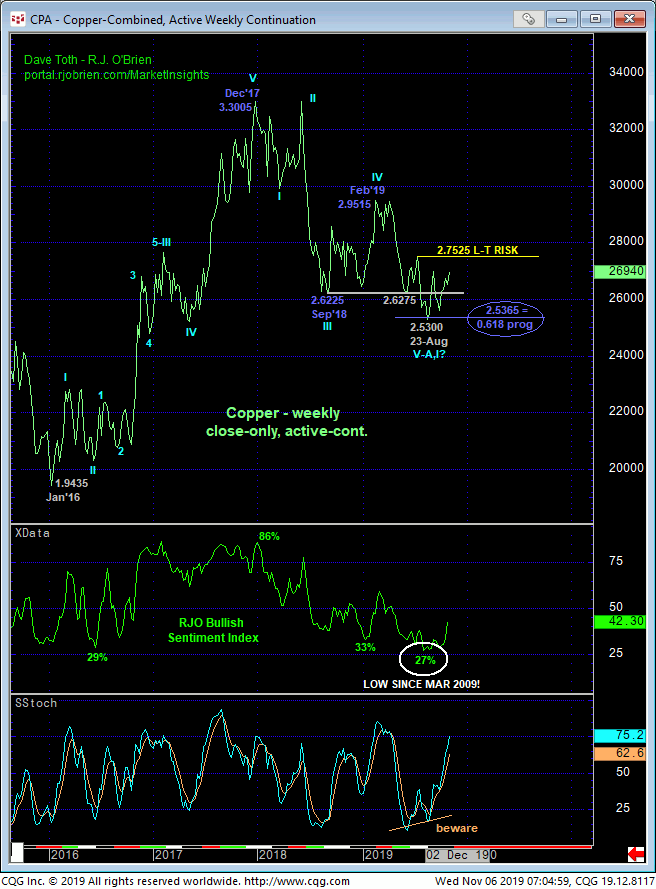
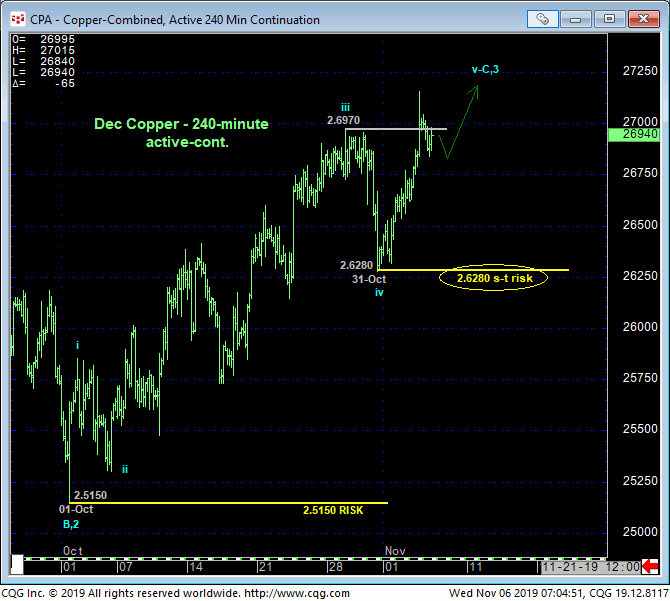
Yesterday’s resumed uptrend above 29-Oct’s 2.6970 high reaffirms the developing uptrend and leaves 31-Oct’s 2.6280 low in its wake as the latest smaller-degree corrective low and new short-term risk parameter this market is now minimally required to fail below to confirm a bearish divergence in momentum, threaten a broader bullish count and expose at least an interim correction lower.
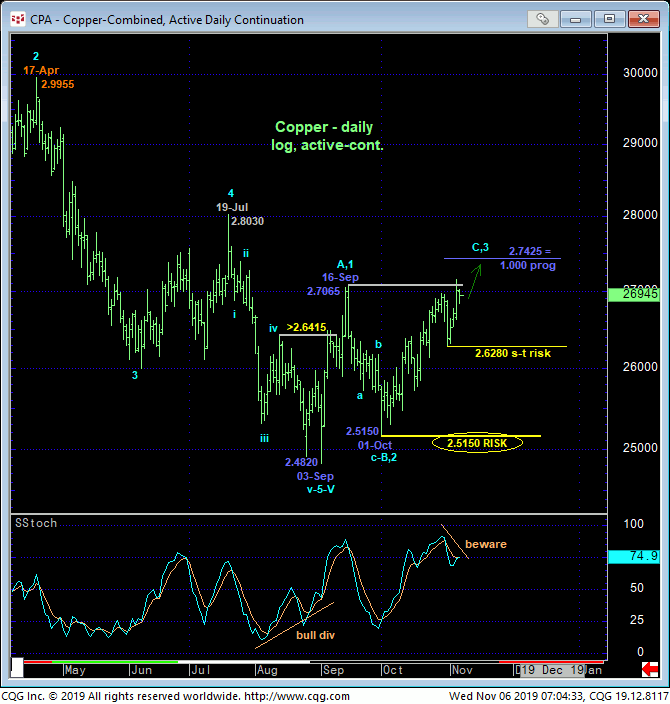
The daily log chart above shows the developing POTENTIAL for a bearish divergence in momentum as well as the market’s break above 16-Sep’s 2.7065 initial counter-trend high that confirms the new longer-term trend as up. The overall recovery from 03-Sep’s 2.4820 low could still be a major 3-wave correction within the nearly 2-YEAR bear trend shown in the weekly close-only chart below, BUT the market needs to confirm some weakness somewhere along the line to break the clear and present uptrend. Smaller- and larger-degree corrective lows at 2.6280 and 2.5150, respectively, are THE EXACT levels and risk parameters around which we’ll objectively gauge developing weakness and vulnerability ahead of a resumed bearish count. Until and unless such weakness is shown, recent historically bearish sentiment levels not seen in TEN YEARS reinforces a base/reversal count that could surprise by its scope in the months and quarters ahead.
In sum, a bullish policy remains advised with a failure below 2.6280 required for shorter-term traders to move to the sidelines and for longer-term players to pare bullish exposure to more conservative levels. In lieu of such weakness, further and possibly accelerated gains straight away should not surprise.
