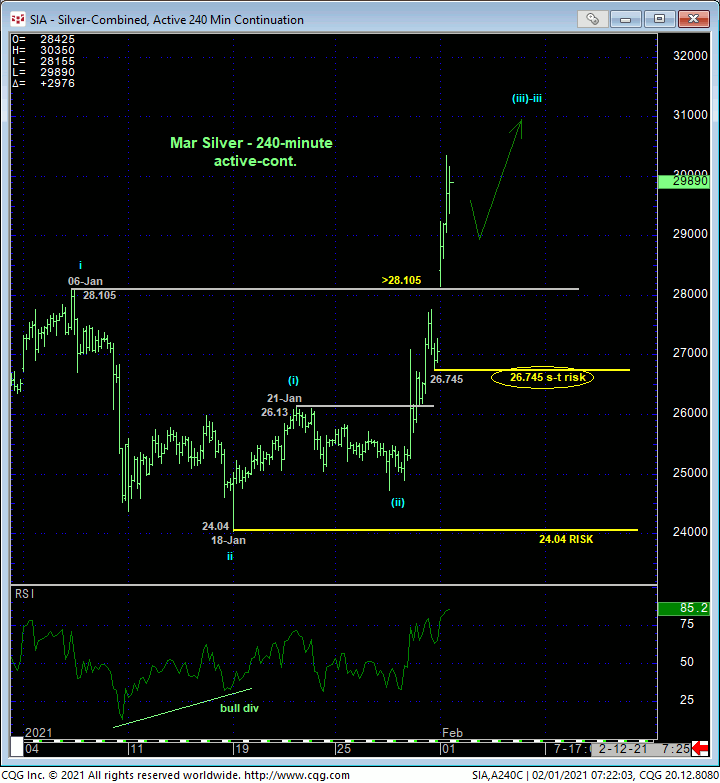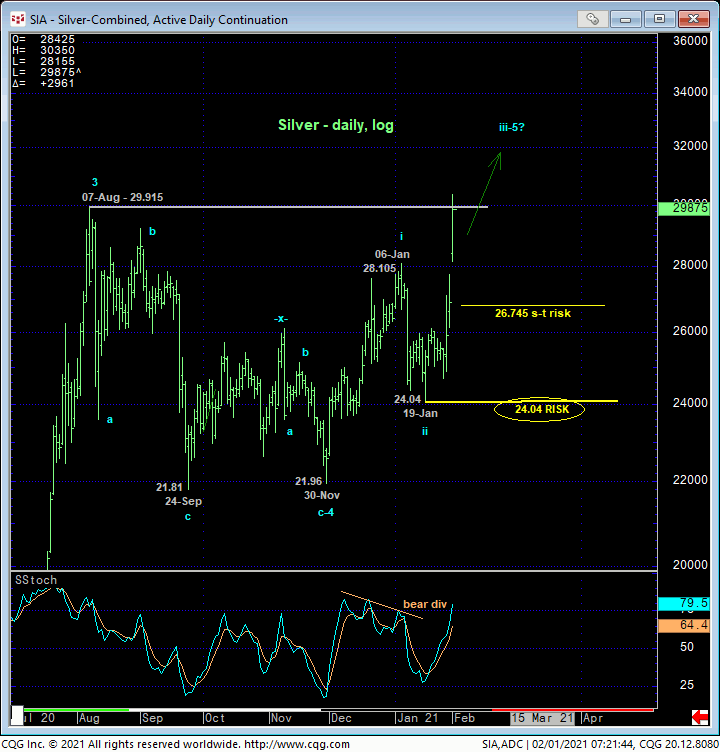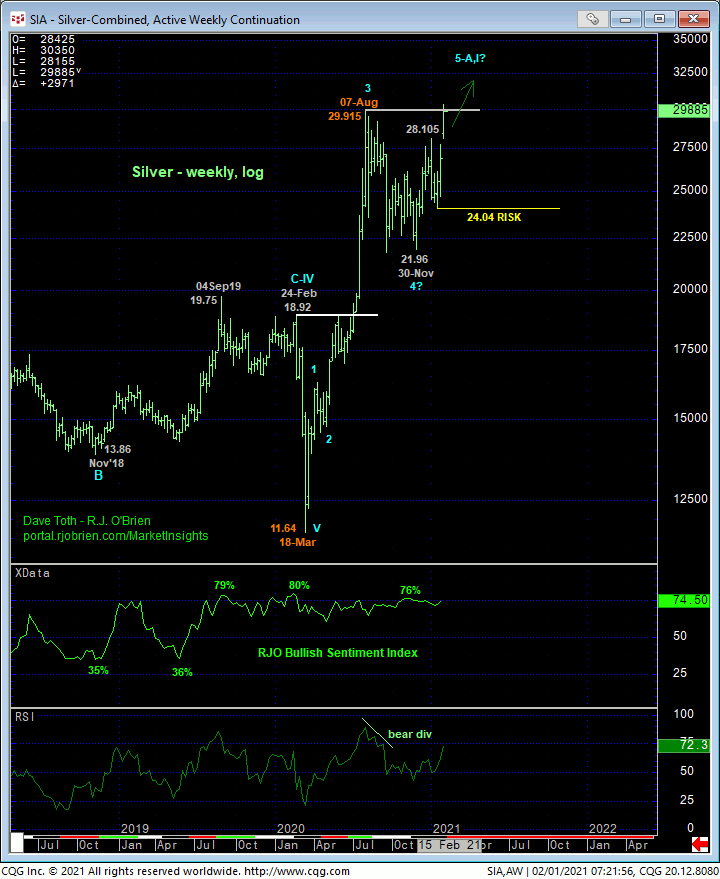

One of the relative shockers today is not the silver market’s continuation of the end of last week’s recovery discussed in Fri’s Technical Webcast, but the fact that this continuation broke 07Aug20’s 29.915 high to reinstate the secular bull trend from 18Mar20’s 11.64 low and produce the highest prices since Feb 2013. This performance confirms the sell-off attempt from that early-Aug high a corrective/consolidative event that now provides the all-important lows and risk parameters from which a resumed bullish policy and exposure can be objectively rebased and managed.
While the academic jury is out as to whether that correction ended at 24-Sep’s 21.81 low or 30-Nov’s 21.96 low, it’s pretty obvious to us that 19-Jan’s 24.04 low serves as the latest larger-degree corrective low this market must not fail below within a resumed broader bullish count. Per such, this level serves as our new long-term risk parameter from which longer-term institutional players can objectively rebase and manage the risk of a resumed bullish policy.
On a shorter-term basis detailed in the 240-min chart above, and while acknowledging now-former 28.105-to-29.915–area resistance as what should be a new support candidate if there’s a lot more of the bull to go, Fri mid-day’s 26.745 low looks to be the latest smaller-degree corrective low that the market would be minimally required to fail below to jeopardize the impulsive integrity of a more immediate bullish count. Per such, this 26.745 level serves as our new short-term bull risk parameter.
As pointed our Fri however when the market was loitering in the middle-half of Aug-Nov’s range where the risk/reward merits of initiating directional exposure were poor, and now UP HERE, a goodly ways away from even our short-term risk parameter, the challenge remains of finding a plausible entry level to a bullish play. The only way we know to address this challenge is to wait for a smaller-degree corrective setback and a setback-stemming bullish divergence in momentum needed to reject/define a more reliable and more practical corrective low from which a bullish punt can then be objectively based.


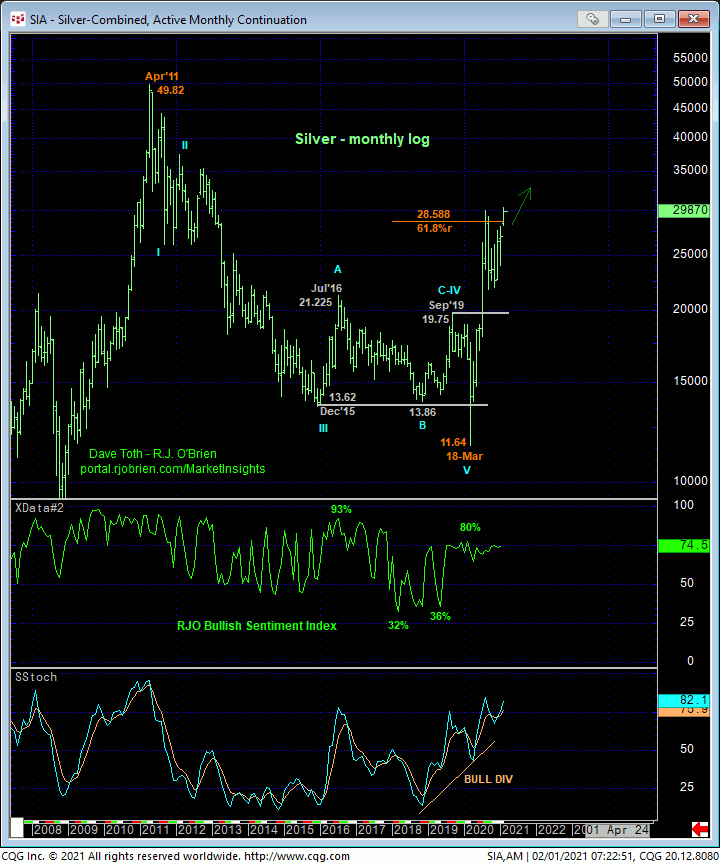
The weekly (above) and monthly (below) log scale charts show this week’s continuation of the secular bull market from last Mar’s 11.64 low. Now-former and massive 27-to-30-area resistance should hold as key new support ahead of whatever the bull has in store for us from here on out where there are NO levels of any technical merit above the market shy f 2011’s 49.82 all-time high. This does not mean we’re forecasting a move to 49-bucks. But it does mean that the market’s upside potential is indeterminable and potentially extreme until and unless arrested by a confirmed bearish divergence in momentum. And this, quite simply, requires proof of weakness below well-defined corrective lows like 24.04.
These issues considered, traders are advised to return to a bullish policy and first approach setback attempts towards suspected support in the 28/29-handle-area as corrective buying opportunities. However, a corrective-setback-stemming bullish divergence in momentum would then be required to reject/define a specific low to the setback that would then serve as our precise new shorter-term risk parameter for such a policy.


