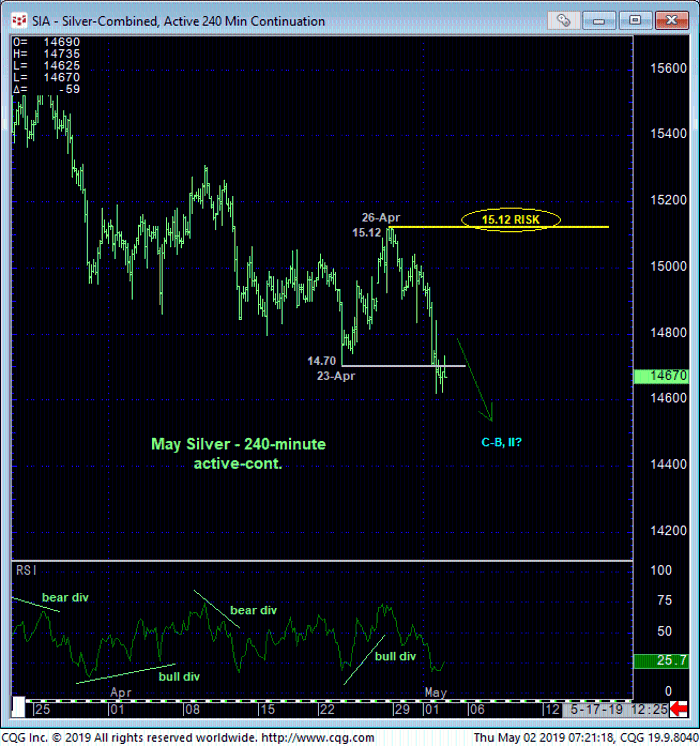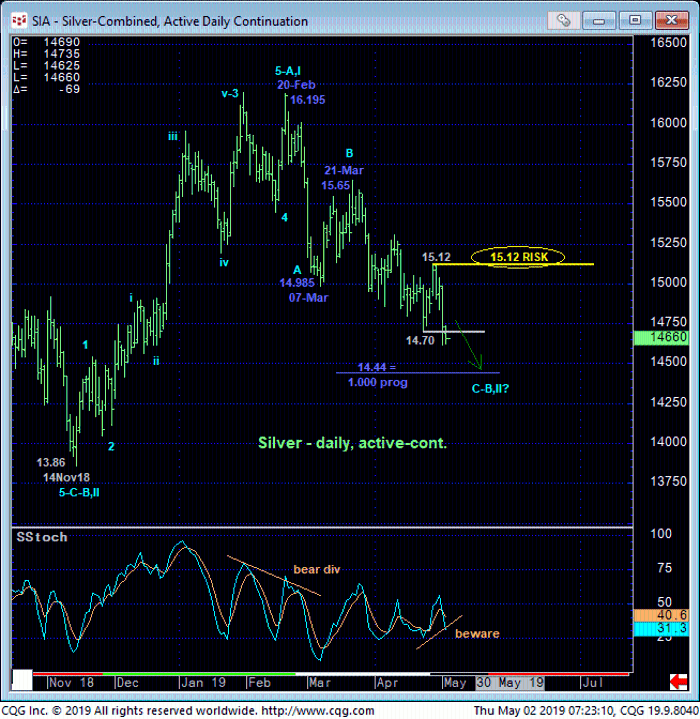
The market’s relapse yesterday below 23-Apr’s 14.70 low and our short-term risk parameter confirmed our suspicions that late-Apr’s recovery attempt was just an interim correction within our broader bearish count introduced in 01-Mar’s Technical Blog calling for at least a major correction of Nov-Feb’s entire 13.86 – 16.195 rally. The important by-product of this resumed weakness is the market’s definition of 26-Apr’s 15.12 high as the latest key corrective high the market now is required to recoup to confirm a bullish divergence in momentum, stem the downtrend and expose potentially significant gains thereafter. Until and unless such 15.12+ strength is shown, further and possibly accelerated losses are expected. In this regard this 15.12 level becomes our new key risk parameter from which a resumed bearish policy and exposure can be objectively rebased and managed.


The daily chart above shows the resumed 2-month downtrend and the developing POTENTIAL for a bullish divergence in momentum Proof of strength above 15.12 is required to CONFIRM the divergence signal to the point of non-bearish action like short-covers and cautious bullish punts. Until and unless such 15.12+ strength is shown, the downtrend is intact on all practical scales and should not surprise by its continuance or acceleration.
Against the backdrop of the:
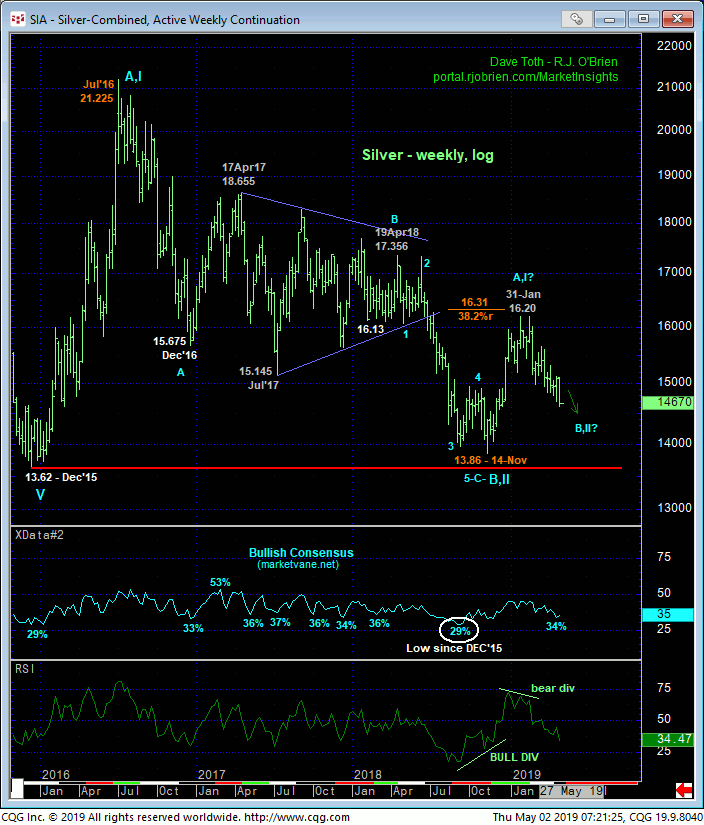
- extent and impulsiveness of Nov-Feb’s rally
- historically bearish sentiment levels in Nov and once again and
- the market’s rejection of the lower recesses of the 3-1/2-YEAR range
a major BASE/correction/reversal environment remains in play. And on this larger scale the past couple months’ relapse cannot be ignored as a corrective buying opportunity for long-term players. But if this is the case, then somewhere between spot and Nov’s 13.86 low the market would be expected to break this downtrend with a confirmed bullish divergence in momentum and reject/define a more reliable low, support and risk parameter from which bullish decisions can only then be objectively based and managed. In lieu of such a relapse-stemming bullish divergence in mo, there’s no way to gauge the depth of this correction OR the prospect that this major base/reversal count is just flat out wrong and that the secular bear trend is prepping for a crash-&-burn to new lows below Dec’15’s 13.62 low.
These issues considered, long-term players remain advised to maintain a bearish policy with a recovery above 15.12 required to negate this call and warrant its cover. Shorter-term traders whipsawed out of bearish exposure following 26-Apr’s bullish divergence in short-term mo are advised to resume a bearish policy at 14.70 OB with a recovery above 15.12 required to negate this call and warrant its cover. In lieu of such 15.12+ strength, further and possibly accelerated losses should not surprise.


