In Mon’s Gold Technical Blog we discussed a relatively minor momentum failure that could be the start of a more protracted correction of the major rally that dates from last Aug’s 1167 low. We believe the extent of early-Feb’s silver relapse cannot be ignored as a similar early step in a correction of Nov-Jan’s entire 13.86 – 16.20 rally for reasons we’ll detail below.
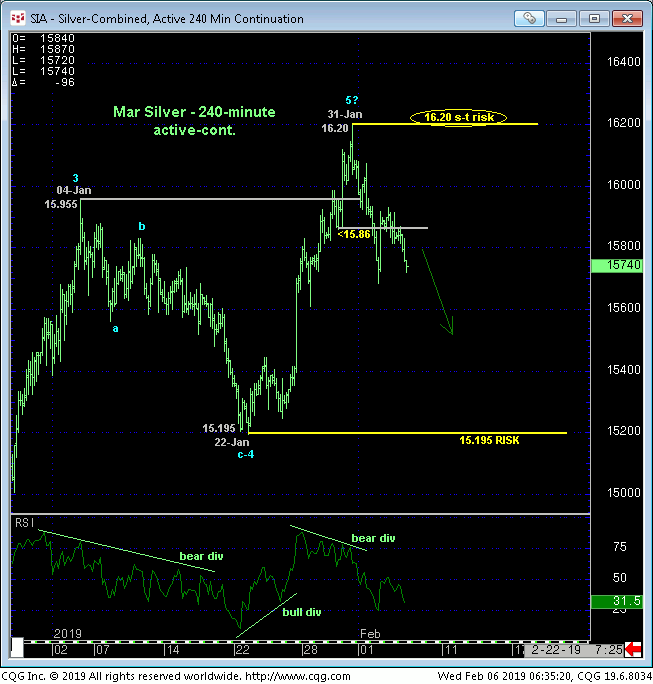
The 240-min chart below shows Mon’s failure below a very minor corrective low at 15.86 from 30-Jan that confirms a bearish divergence in short-term momentum. This mo failure identifies 31-Jan’s 16.20 high as the end of at least the portion of the bull from 22-Jan’s 15.195 low, and per such acts as our new short-term risk parameter from which non-bullish decisions like long-covers and cautious bearish punts can now be objectively based and managed.

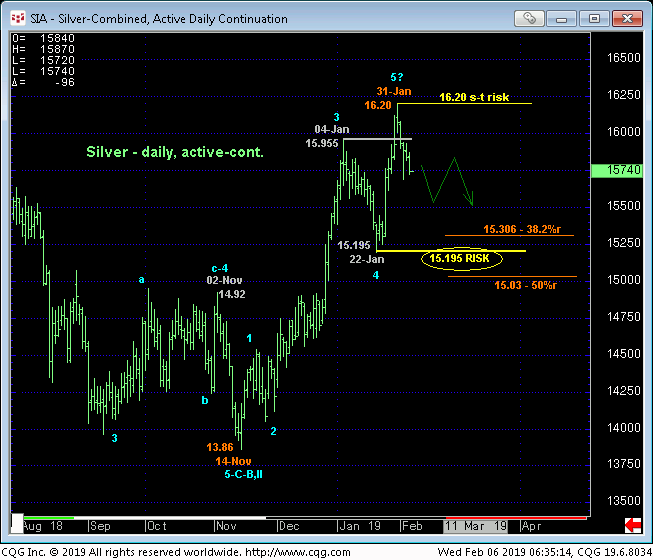
From a longer-term perspective the daily chart below shows how late-Jan’s portion of the rally could be the completing 5th-Wave of a 5-wave sequence from 14-Nov’s 13.86 low that, if correct, would warn of a correction that could span months and drive prices to at least the 15.30-to-15.03-range and perhaps much lower. This said, commensurately larger-degree weakness below 22-Jan’s 15.195 next larger-degree corrective low remains required to, in fact, break the 2-1/2-month uptrend.
Given the impracticality of having to wait that long for confirmation, this is arguably a situation where longer-term players may want to take a page from the shorter-term trader’s playbook and exchange whipsaw risk (above 16.20) for larger nominal risk by paring or neutralizing bullish exposure from current 15.75-area prices.

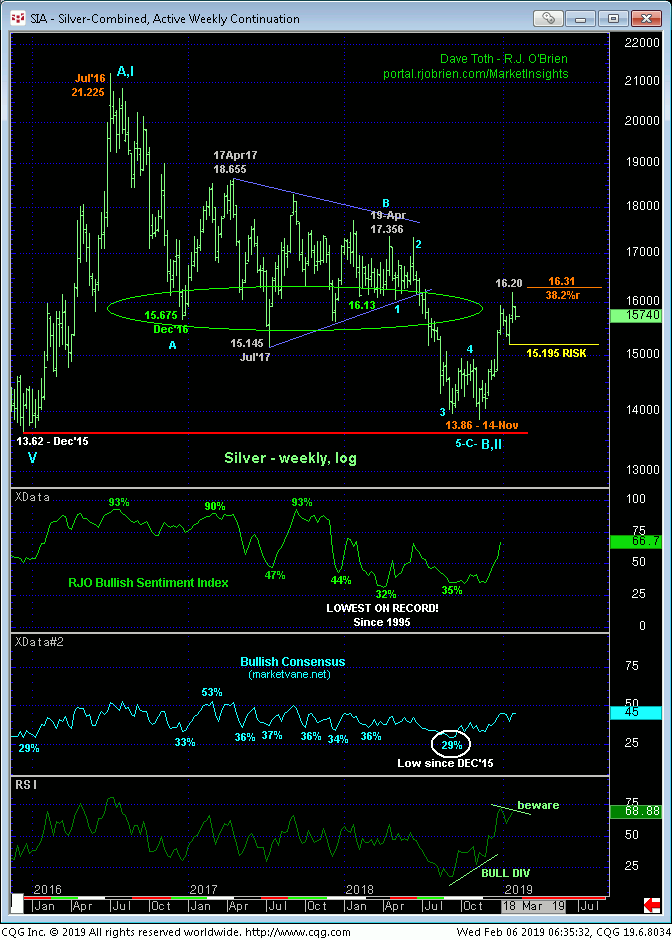
Contributing to a count calling that suggests Nov-Jan’s rally may have run its course is the fact that this recent relapse stems from a hugely important area we’ve discussed often as a key resistance candidate. The weekly log chart below shows the monstrous support from the 15.15-to-16.15-area that held the market up from Dec’16 until Jul’18’s breakdown. On this first recovery attempt back to this area, traders have been advised to approach this area as key resistance.
This week’s bearish divergence in momentum is admittedly of a minor scale that renders a more significant peak/reversal conclusion premature. Until and unless this market recoups 31-Jan’s 16.20 high however, traders are advised to beware increased odds for such a setback and act accordingly within the bounds of their personal risk profiles.
These issues considered, we advise traders to neutralize all previously recommended bullish policy and exposure ahead of a correction lower that could be extensive. A recovery above 16.20 is required to negate this call, reinstate the bull and re-expose an uptrend that could have extensive gains thereafter. In lieu of such 16.20+ strength we anticipate further and possibly protracted losses to at least the 15.30-to-15.03-area.


