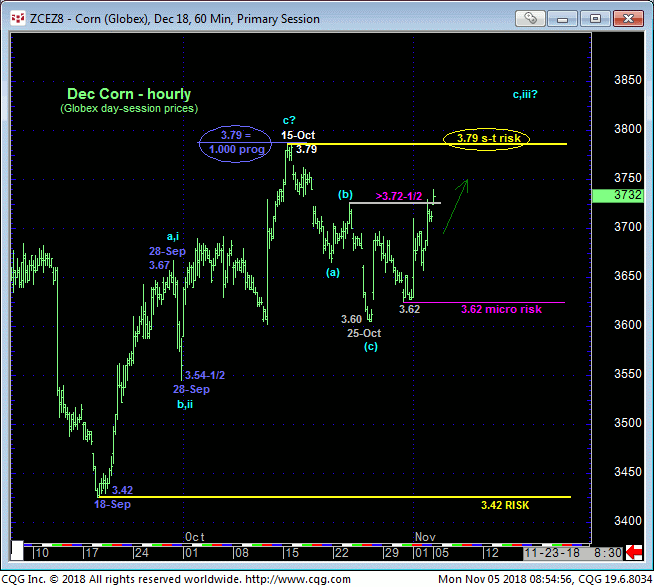
We are not going to make a mountain out of the market’s mole hill recovery above 23-Oct’s 3.72-1/2 high, but this rebound does expose Oct-15-to-25th’s 3.79-to-3.60 setback a 3-wave and thus corrective event as labeled in the hourly chart below. Left unaltered by a relapse below 3.60, this 3-wave dip is considered a corrective/consolidative affair that warns of a resumption of Sep-Oct’s uptrend that preceded it.
This rebound also leaves Wed’s 3.62 low in its wake as a very minor corrective low and micro risk parameter it is not minimally required to relapse below to render the recovery attempt from 25-Oct’s 3.60 low a similar 3-wave affair that would turn the pendulum lower. 15-Oct’s 3.79 high also remains intact as THE short-term hurdle and risk parameter the market remains required to break to reinstate our long-term base/reversal count introduced in 21-Sep’s Technical Blog. In effect then we believe the market has identified 3.79 and 3.62 as the key directional triggers heading forward.

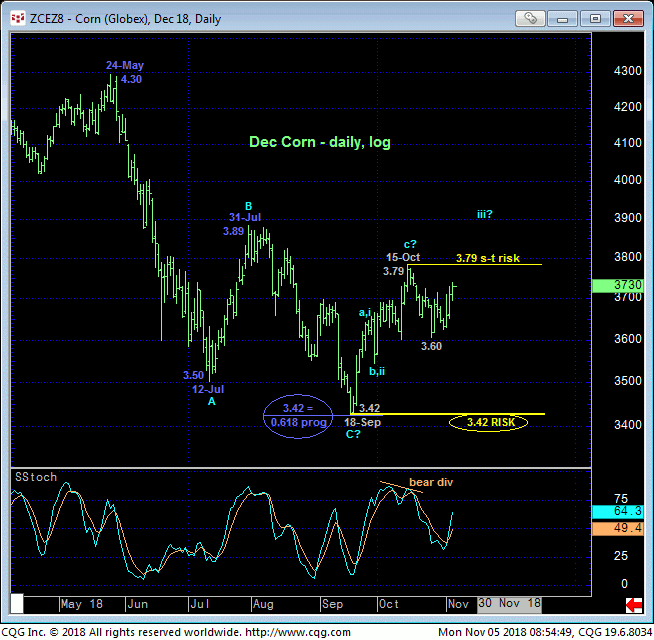
The past three weeks’ price action has been agonizingly choppy within a boring 20-cent range that’s a sleeper. A whole lotta nothin’ goin on except whipsaw. And the middle-half of the past FOUR MONTHS’ range shown in the daily log chart below is exactly where such aimless price action typically occurs. But while it’s hard to read too much into such range-center chop, traders are warned not to miss the forest through the trees.

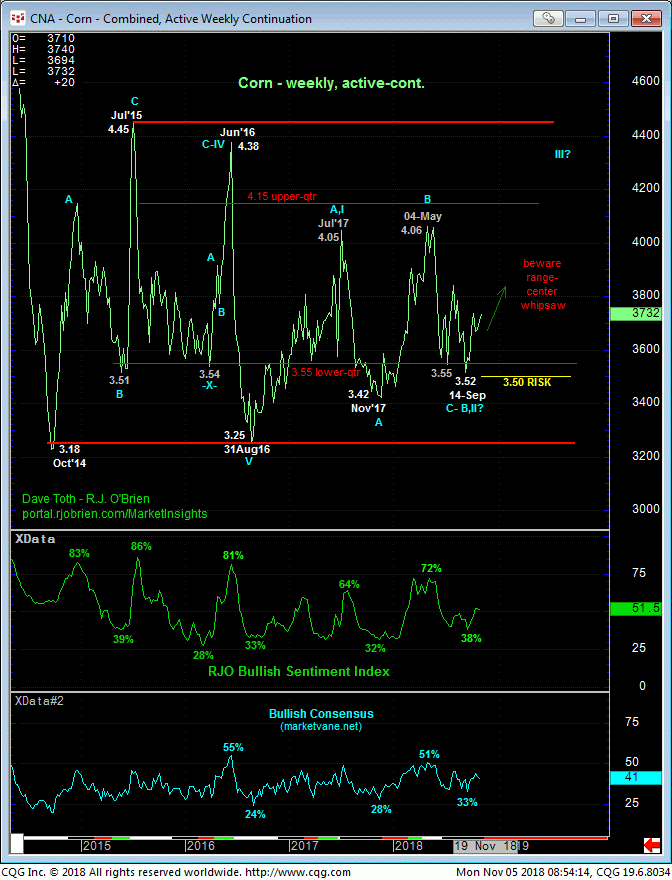
Indeed, after 12-Jul’s 3.50 low on 13-Sep, the market spent exactly four days and only 8-cents below that pivotal broken low before failing miserably to sustain those lows and confirming a bullish divergence in momentum that ended the slide. Since then the market has had little luck sustaining any price action lower. When taken against the backdrop of this market’s FOUR YEAR history of rejecting/failing to sustain losses below the (3.55) lower-quarter of the four year lateral range shown in the weekly close-only chart below, traders are advise not to ignore the prospect of this slow, boring turn-back-up as something that could surprise to the upside.

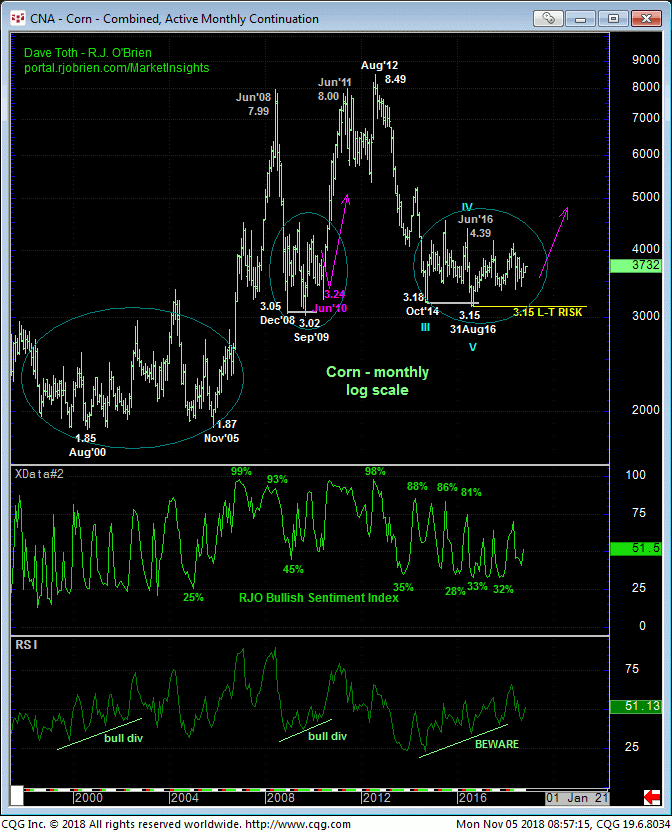
The weekly chart above shows the market re-engaging the middle-half bowels of the incessant 4-year lateral range where no one will be surprised by another YEAR’S worth of aimless chop, suggesting it won;t be until the 2019 crop year where the timing of a sharp move would seem more logical. In the monthly log chart below we continue to maintain that the past four years’ lateral chop is that of a major base/reversal process similar to those that unfolded between Dec’08 and Jun’10 and between 1998 and 2006.
The timing/time-of-year of Jul-Aug-Sep 2010’s sharp reversal higher seems understandable. And while the market was in a solid, if intra-range uptrend from Nov 2005 until Jun 2006, the bull exploded and never looked back during Oct and Nov that year.
Could we see a repeat this year? Most would say it’s unlikely. And we would not disagree. While the market sustains levels above at least 3.62 however, and especially if it breaks above 3.79, the question isn’t one of whether the market will rally sharply and shockingly, but rather whether you want to bet against such a move.
These issues considered, long-term players remain advised to maintain a bullish policy and exposure with a failure below 3.62 required to pare exposure to more conservative levels and commensurately larger-degree weakness below 3.42 to jettison the position altogether. Shorter-term traders are OK to maintain either a bearish policy or a bullish one with a recovery above 3.79 negating the former bearish count and relapse below 3.62 negating what we believe is a resumed bullish count. A breakout above 3.79 will reinforce a broader base/reversal environment that could produce surprising gains immediately thereafter.


