JUN CRUDE OIL
Since 22-Apr’s bullish divergence in short-term momentum discussed in that day’s Technical Blog, we’ve discussed the correction-vs-reversal dilemma and challenge as the major downtrend has at least been interrupted. The importance of this interruption, if only on a short-term basis, is the market’s definition of more reliable lows and support that now can be used as objective risk parameters from which to base non-bearish decisions like short-covers and cautious bullish punts rather than trying to catch the falling knife.
As the market has yet to break 23-Apr’s 18.26 high needed to identify that high as an initial (A- or 1st-Wave) high, the market has yet to confirm a bullish divergence on a larger-degree-needed DAILY basis. But yesterday and today’s rebound from a survived retest of 21-Apr’s 6.50 low is impressive and puts the market within spittin’ distance of this key 18.26 threshold, the break above which would be the next reinforcing factor for AT LEAST a larger-degree correction and possibly a major reversal.
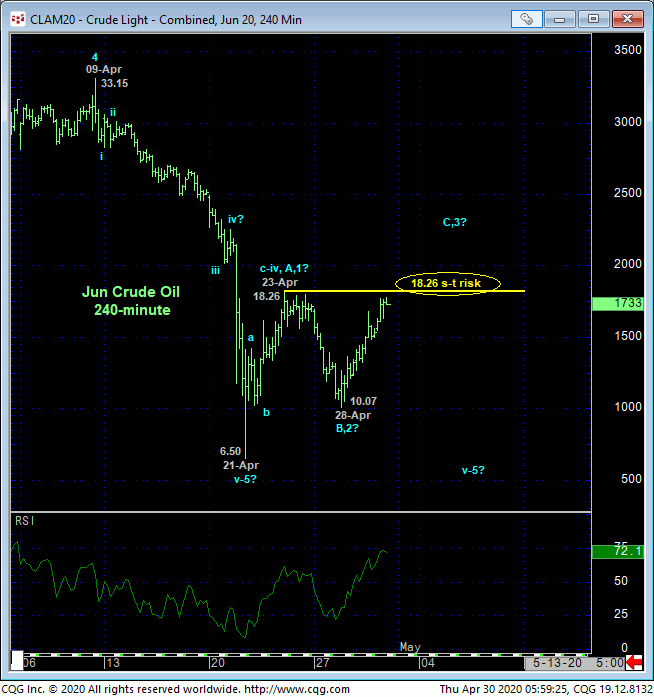
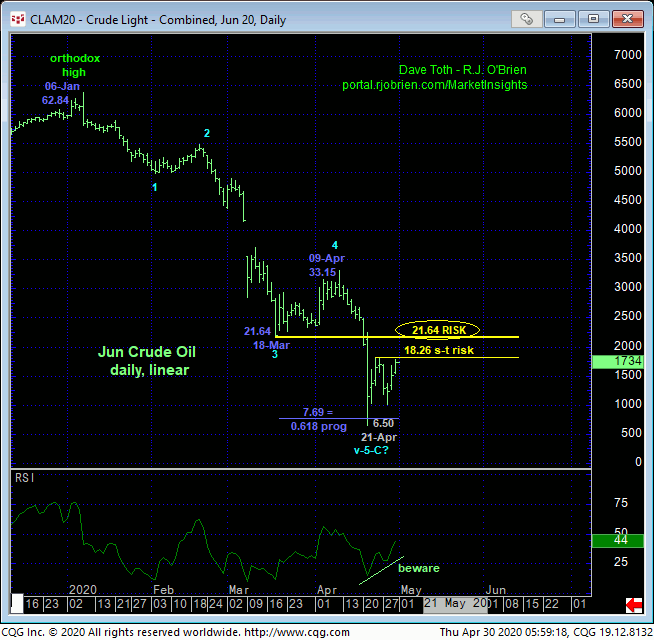
The daily chart of the Jun contract above shows the nicely developing potential for a bullish divergence in momentum. A break above 23-Apr’s 18.26 high will CONFIRM this divergence to the point of non-bearish action like short-covers and cautious bullish punts, leaving 28-Apr’s 10.07 low in its wake as our new short-term but key risk parameter to a developing bullish policy.
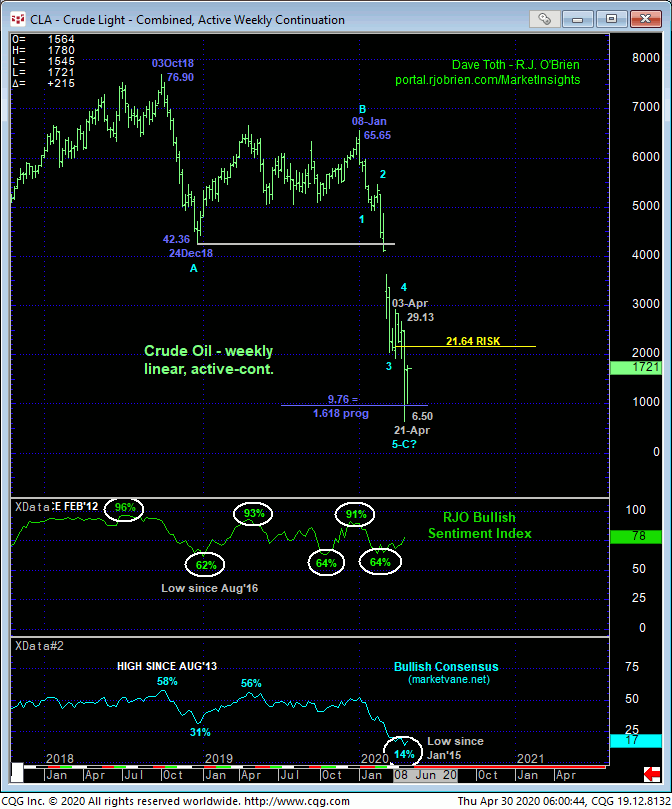
To be clear, from a long-term perspective, even a break above 18.26 leaves the market still well within the bounds of a mere correction within the secular bear trend. Indeed, continued trendy, impulsive strength above at least former 21.64-area support-turned-resistance and preferably above 09-Apr’s 33.15 larger-degree corrective high remains required to really threaten and then negate the long-term bear market. But if/when the market does break above 18.26, we will have Tue’s 10.07 low as THE SPECIFIC level around which to gauge the bear’s resurgence.
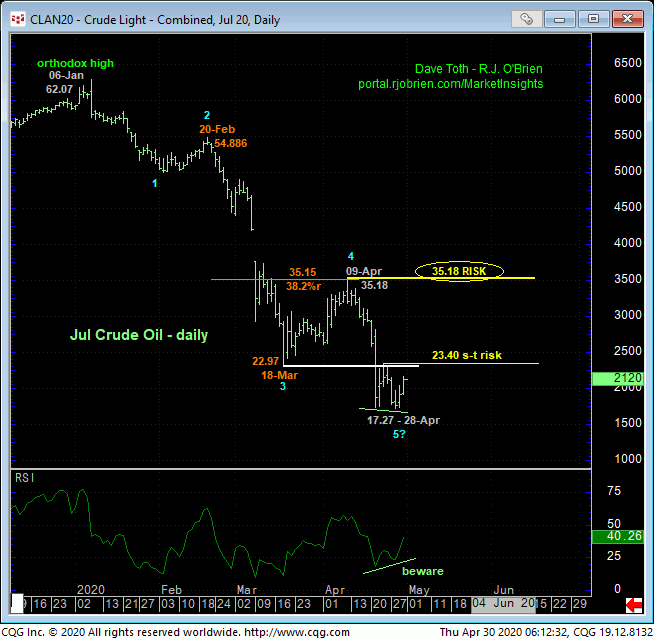
In the Jul contract shown in the daily chart below, the key short- and longer-term risk parameters around which to base non-bearish decisions are 23.40 and 35.18, respectively.
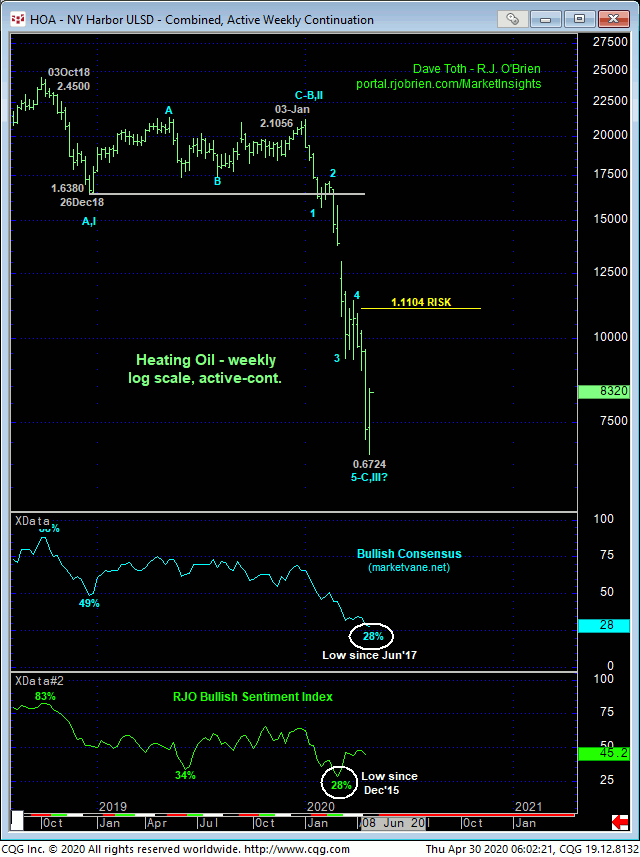
Finally, the weekly active-continuation chart below shows the magnitude of the secular bear market, the understandably historically bearish sentiment levels generated and the prospect that the decline from 08-Jan’s 65.65 high is a complete or nearly complete 5-wave Elliott sequence. Despite developing bullish elements, the market has yet to provide enough strength to set these elements off and warrant moving to a new bullish policy. But such base/reversal requirements typically don’t occur in one fell swoop, but rather gradually with minor victories within the broader base/reversal process. A move above 18.26 will be such a victory.
These issues considered, a bearish policy remains advised, with a recovery above 18.26 (23.40 in the Jul contract) required for shorter-term traders to move to the sidelines and for longer-term players to pare bearish exposure to more conservative levels. Commensurately larger-degree strength above 21.64 is required for longer-term players to jettison bearish exposure altogether to circumvent the heights unknown of a larger-degree correction or major reversal higher.
This said, it’s one thing to neutralize bearish exposure and prevent upside bleeding, and another thing altogether to consider levels from which to move to new bullish exposure as the risk/reward merits of chasing initial counter-trend rallies is poor. If the market recovers above these key risk parameters discussed above, we we then look for proof of labored, corrective relapse attempts AND a relapse-stemming bullish divergence in short-term mo to define a more reliable level from which favorable risk/reward buying conditions will be more objectively based.
JUN HEATING OIL
Crude oil is not the only energy market showing a pulse. The extent and impulsiveness of the past couple days’ recovery in heating oil is impressive as it warns that Tue’s 0.6724 low might have completed a 5-wave Elliott sequence down from 03-Apr’s 1.1104 high as labeled in the 240-min chart below. The market still needs to recoup 23-Apr’s 0.8632 corrective high needed to, in fact, confirm a bullish divergence in momentum and break this portion of the downtrend, but as you can see, it’s getting close.
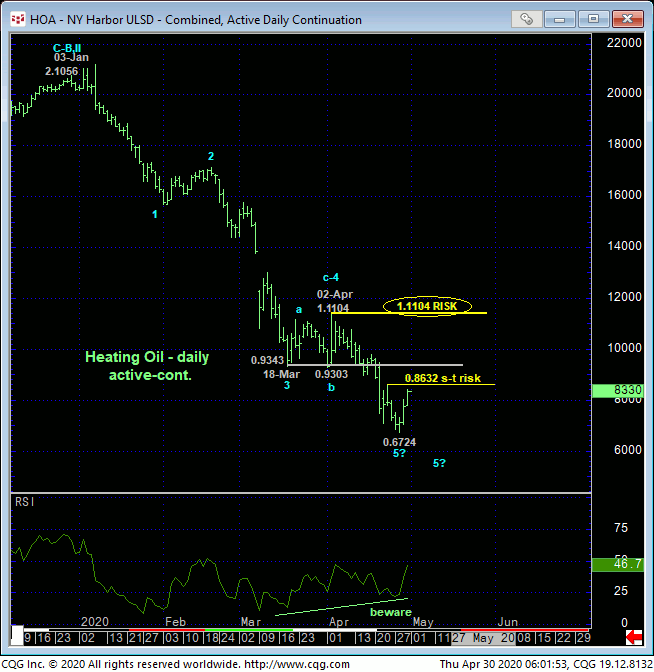
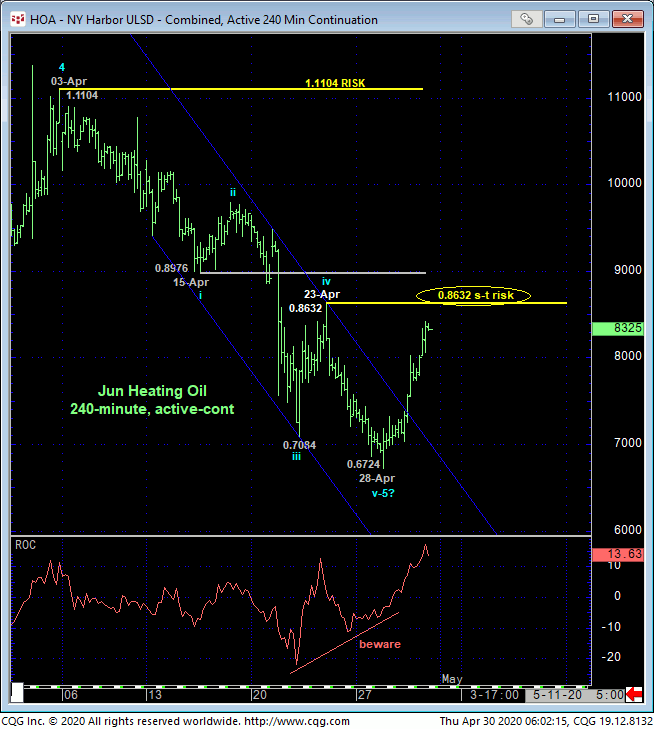
What’s very compelling ab out the potential for a bullish divergence in short-term momentum above is that it’s easy to see that Apr’s portion of this year’s meltdown could be the completing 5th-Wave of the decline from 03-Jan’s 2.1056 orthodox high. This count is arguably “textbook”. HOWEVER, it is certainly noted that one cannot conclude a major bottom from just smaller-degree strength above a level like 0.8632. Indeed, commensurately larger-degree strength above at least former 0.93-handle-area support-turned-resistance and preferably above 02-Apr’s 1.1104 larger-degree corrective high and key risk parameter. But proof of strength above 0.8632 is an embryonic and required step in that direction.
Finally and understandably, sentiment/contrary opinion levels have reached historically bearish levels typical of major base/reversal environments. We have no doubt whatsoever that this element will contribute mightily to a major reversal higher. But traders are reminded that sentiment is not an APPLICABLE technical tool in the absence of as confirmed bullish divergence in momentum of a scale sufficient to break the major downtrend. A break above 0.8632 would be insufficient in this regard (but it’d be a start).
In sum, a bearish policy remains advised with a recovery above 0.8632 required for shorter-term traders to move to the sidelines and for longer-term players to pare exposure to more conservative levels. Continued strength above the 0.93-handle would be sufficient for long-term players to pare exposure even further or neutralize altogether.