Posted on May 17, 2023, 08:10 by Dave Toth
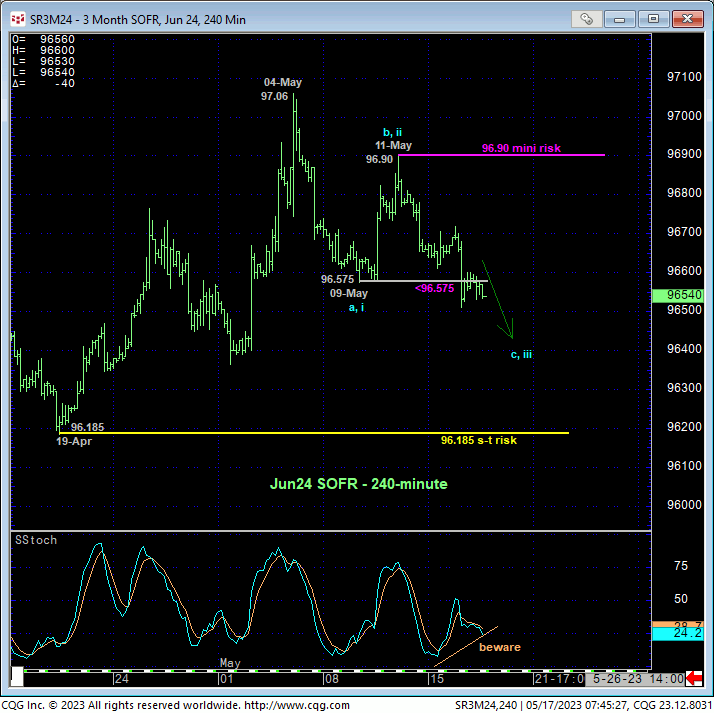
Yesterday’s slip below 09-May’s 96.575 initial counter-trend low in the Jun24 contract confirms a bearish divergence in daily momentum and leaves 11-may’s 96.90 high in its wake as the latest smaller-degree corrective high this market now is required to recover above to render the sell-off attempt from 04-May’s 97.06 high a 3-wave and thus corrective affair that would re-expose a major base/reversal count. Until and unless such strength above 96.90 is proven, there’s no way to know that this decline isn’t the 3rd-Wave of a more protracted, if corrective move south. On this very short-term basis then, this 96.90 level serves as a mini parameter from which very short-term traders can objectively base and manage non-bullish decisions like long-covers and cautious bearish punts.

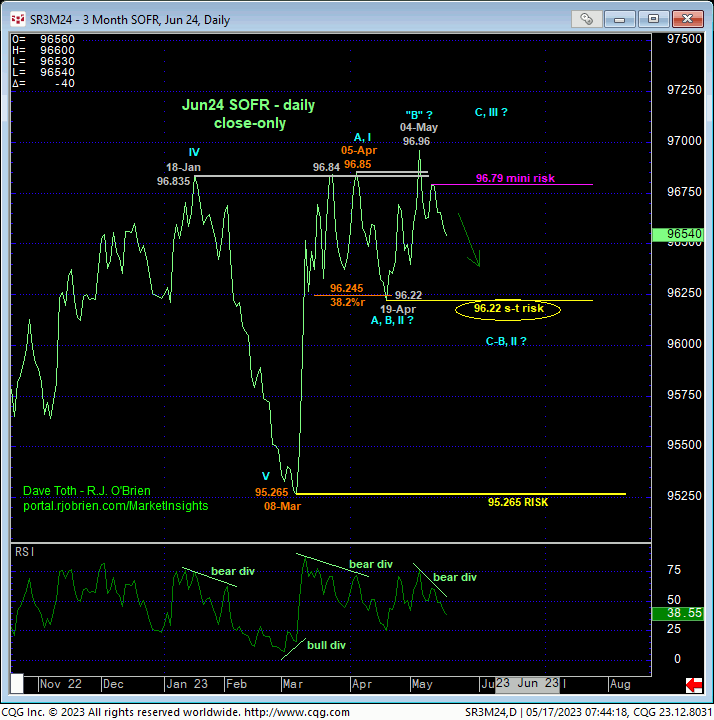
The daily close-only chart of the Jun24 contract below shows the bearish divergence in momentum. What may prove more important from an intermediate-to-longer-term perspective is this market’s failure thus far to sustain early-May gains above the prior FOUR MONTHS’ resistance around the 96.83-to-96.85-area. Combined with what appears to be only a 3-wave rally from 19-Apr’s 96.22 low close to 04-May’s 96.96 high, we have to consider the prospect that this market is still in a B- or 2nd-Wave correction DOWN from 05-Apr’s 96.85 high, with the break to 96.22 being only the A-Wave component of the correction and the pop to 96.96 being the B-Wave “irregular” (because it went to a new high above the start of the correction). If correct, this count warns of what would be expected to be a sharp, impulsive C-Wave break to a new low close below 19-Apr’s 96.22 low. To threaten or mitigate this interim bearish count, the market would need to close above 10-May’s 96.79 high and/or recover above 11-May’s 96.90 intraday high as discussed above.

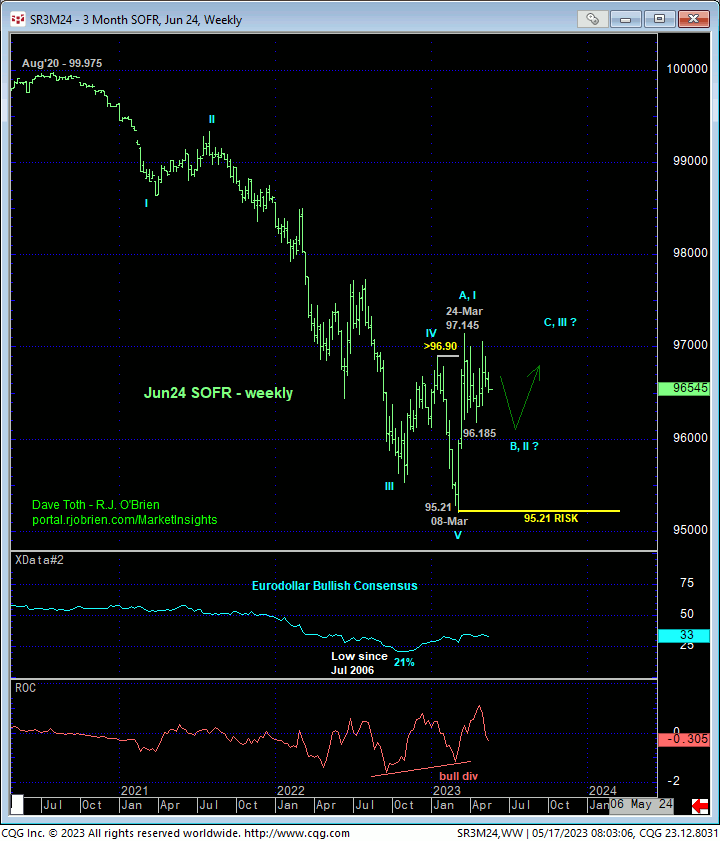
From an even longer-term perspective however, the weekly chart below shows the early stages of what we believe is a major base/reversal count up from 08-Mar’s 95.21 low. This major base/reversal count is predicated on:
- a confirmed bullish divergence in WEEKLY momentum amidst
- historically bearish levels in the Bullish Consensus (marketvane.net) not seen since 2006 and
- an arguably complete and massive 5-wave Elliott sequence down from Aug’20’s 99.975 high.
To negate this count, the market needs to break 08-Mar’s 95.21 low and key long-term bull risk parameter. While that low remains intact, relapse attempts, even an “extensive” one below mid-Apr’s 96.185 low, fall within the bounds of a (B- or 2nd-Wave) correction within this major base/reversal-threat PROCESS. As is typical of such major reversal processes, the technical and trading matter of SCALE becomes of paramount importance. And herein lies the importance of identifying flexion points and risk parameters of various scales like the mini, short- and long-term risk parameters discussed above at 96.90, 96.185 and especially 95.21. Traders are advised to toggle directional biases and exposure around these levels commensurate with their personal risk profiles.


