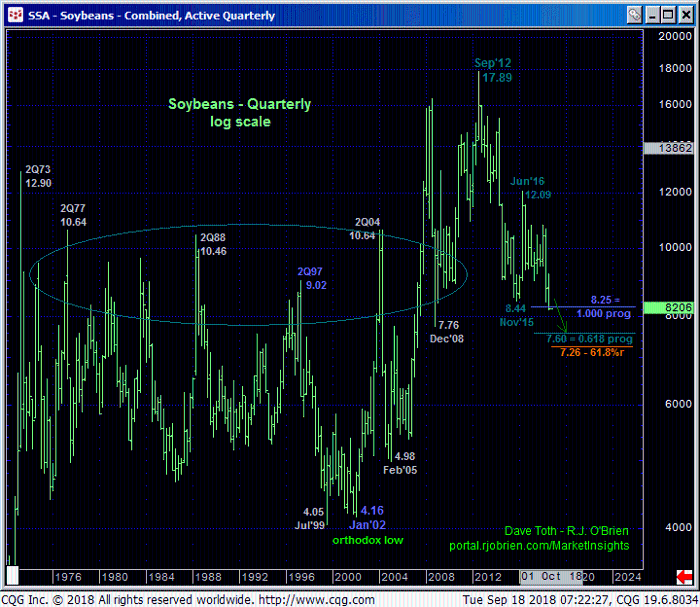
Quite simply, the past couple days’ resumed weakness below the 8.28-to-8.21-area reinstates the secular bear trend that dates from 04-Sep-2012’s 17.89 all-time high. The trend is down on all scales with and should not surprise by its continuance or acceleration as it has exposed an area totally devoid of any technical levels of merit below it. In effect, there is no support.
The crucial by-product of this resumed weakness is the market’s definition of smaller- and larger-degree corrective highs at 8.52 and 9.22 as shown in the daily chart below. These levels represent our new short- and longer-term risk parameters from which a full and aggressive bearish policy and exposure can be objectively rebased and managed.
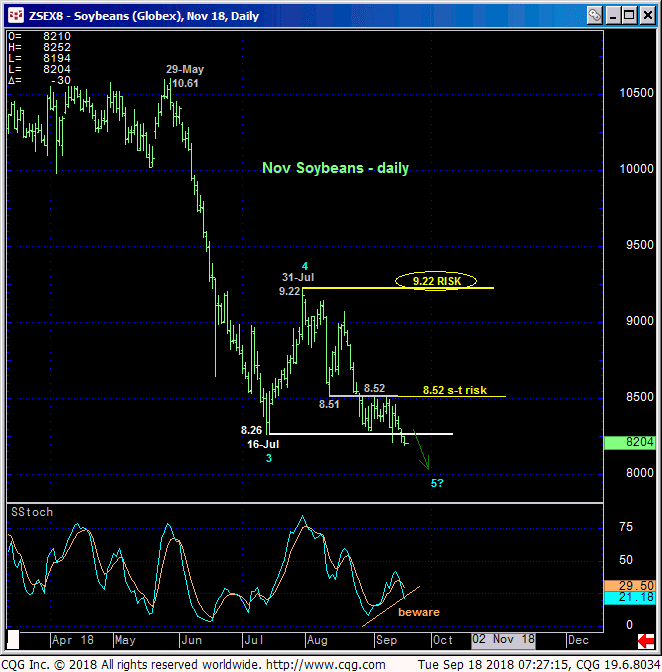
On a daily close-only basis below, former 8.31-to-8.34-area support is now fully expected to hold as new resistance ahead of further and possibly protracted losses. A daily close above 10-Sep’s 8.47 minor corrective high would be considered a very early threat to the bear that could warrant some paring of bearish exposure. The developing POTENTIAL for a bullish divergence in momentum is clear in both the daily charts above, but this means nothing until and unless the market PROVES strength above the prior corrective highs and risk parameters we’ve defined.
And of course and as always, utterances of this (or any) market being “oversold” simply because any of the momentum indicators are below “some level” like 25% or outside the bounds of technical discipline, at least at RJO, as the momentum “tail” never, ever wags the underlying market “dog”.
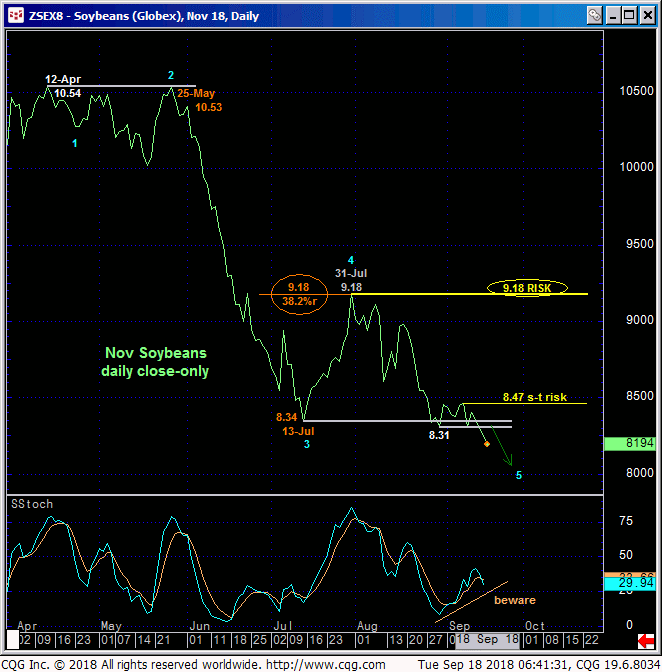
Historically bearish sentiment typical of major BASE/reversal environments, an arguably completing 5-wave Elliott sequence down from Mar’s 10.83 high and waning downside momentum on a WEEKLY basis below are certainly elements to consider, but these will ONLY come into play as “applicable” technical tools IF/when the market stems the clear and present downtrend with proof of strength above the risk parameters identified above.
We would also remind traders that this market has a history of taking our major lows by only a few cents before reversing in a major way. But until and unless this market recoups at least 8.52 and preferably 31-Jul’s 9.22 larger-degree corrective high, further and possibly protracted losses should not surprise.
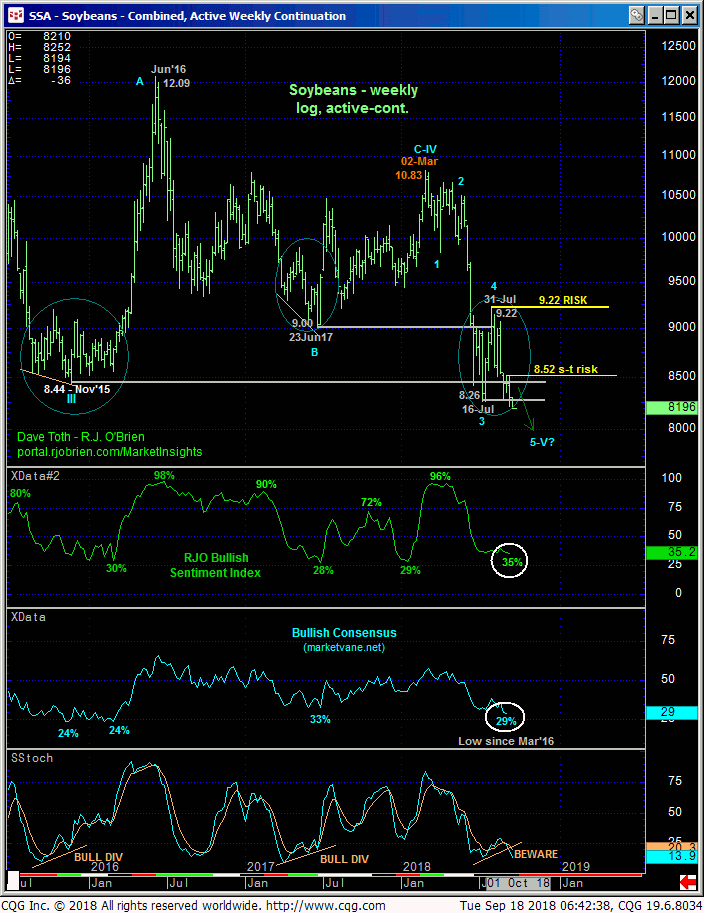
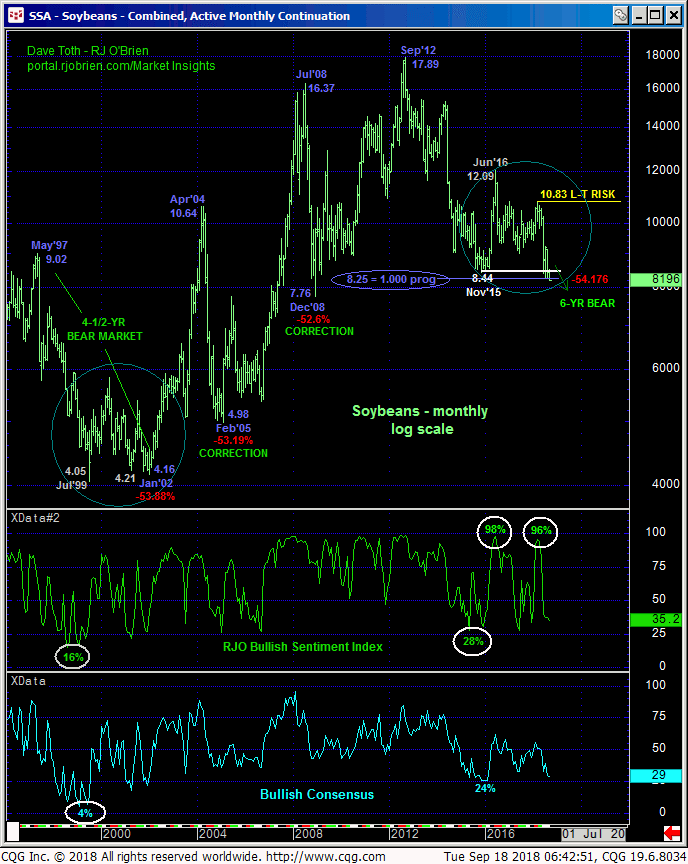
Moving out to even broader perspectives, the monthly (above) and quarterly (below) log scale charts show this 6-year bear exposing an area totally devoid of any technical levels of merits now that it has broken Nov’15’s 8.44 low. We have listed various Fibonacci progression and retracement relationships at 8.25, 7.60 and 7.26, but in the absence of an accompanying bullish divergence in momentum- which requires a recovery above a prior corrective high- we don;t consider these levels any more important than any other merely derived and otherwise totally useless levels like Bollinger Bands, imokus, channel lines and the ever-useless moving averages.
We throw these levels out there to give some sort of “proportion” to previous moves as well as to remind traders of the historical nature of this bear. To suggest this market could not drop another dollar or two would be a mistake. By breaking the Nov’15 low at 8.44, the bear has every opportunity now to PERFORM STRAIGHT AWAY and in line with what apparently are historically horrendous fundamental elements. Against this backdrop this market should NOT even come close to recovering above 31-Jul’s 9.22 corrective high and key risk parameter and perhaps not even our shorter-term risk parameter at 8.52. These corrective highs and risk parameters are crucial however as such historically bearish fundamental conditions accompany virtually every major base/reversal environment.
In sum, the trend is not only down on all scales, it has exposed an area totally devoid of any technical levels of merit. In effect, there is no support and further, even relentless losses should not surprise straight away. A full and aggressive bearish policy and exposure remain advised with a recovery above 8.52 required for shorter-term traders to move to the sidelines and longer-term players to pare bearish exposure to more conservative levels.
