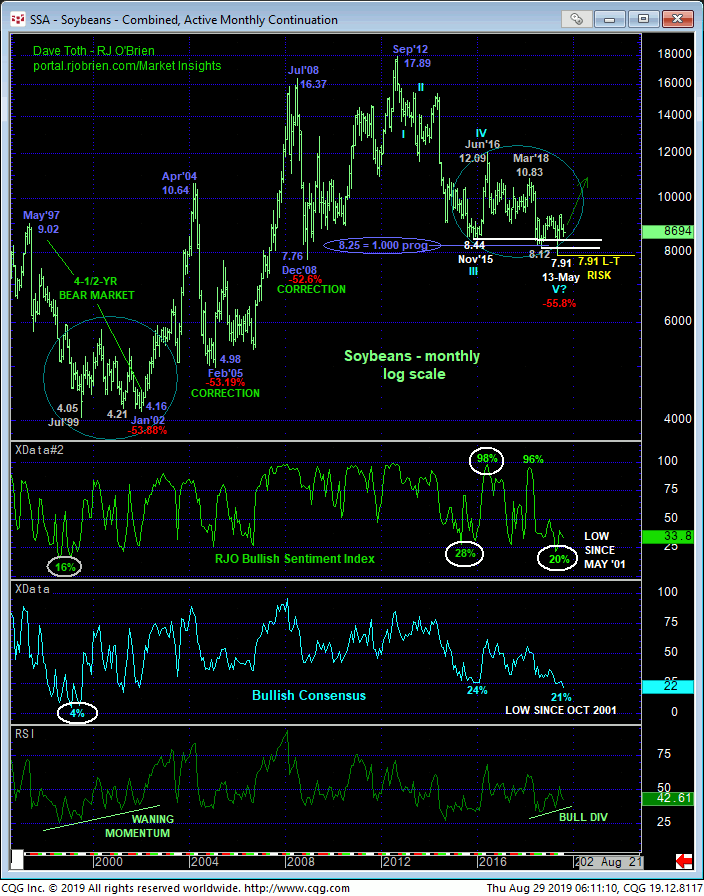
In 16-Aug’s Technical Blog on corn, we discussed how the going’s getting tough for corn bears “down here” at these levels with respect to what we still believe is a major, multi-year BASE/reversal environment. The same thing applies to soybeans, with even more compelling base/reversal-threat factors. TO BE CLEAR, the market has yet to confirm a bullish divergence in even short-term momentum needed to stem even Aug’s portion of the 2-month decline from 18-Jun’s 9.48 high, let alone the broader 2-month slide. But while the proverbial fat lady hasn’t sung yet with respect to a base/reversal count, for the factors we’ll discuss below we believe she’s warmin’ up.
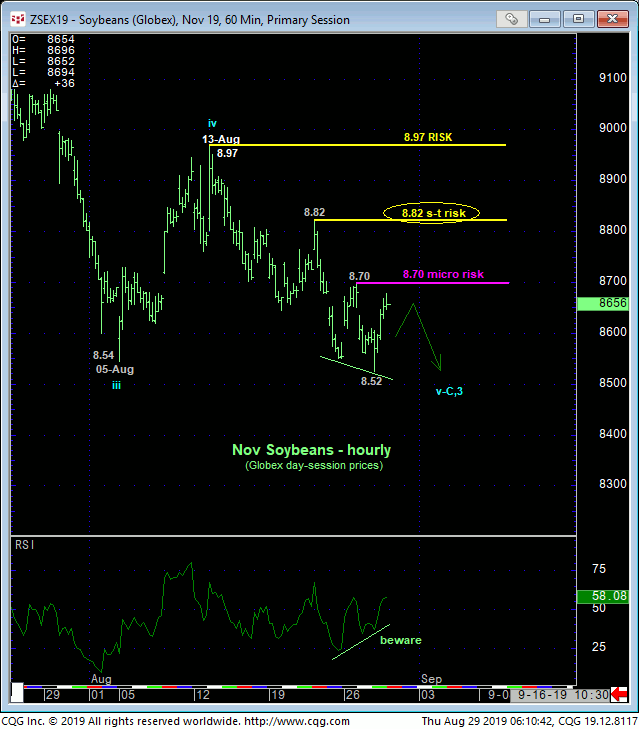
Starting on a very short-term basis, the hourly chart below shows the very orderly manner in which this month’s portion of the downtrend has unfolded, leaving corrective stair-steps all the way down at 8.97, 8.82 and even Mon’s 8.70 high. These levels represent specific and objective risk parameters the market is expected to sustain losses below per any broader bearish count, including a resumption of the secular bear trend to new lows below 7.91. It’s failure to do so will increasingly threaten any such broader bearish count and reinforce a broader base/reversal count that ultimate would warn of a resumption of Mau-Jun’s rally to eventual new highs above 9.50, and possibly well beyond that point.
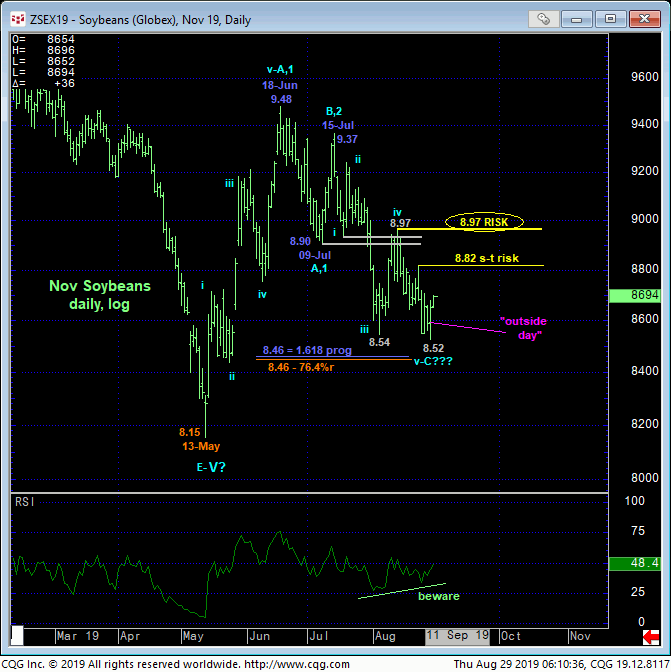
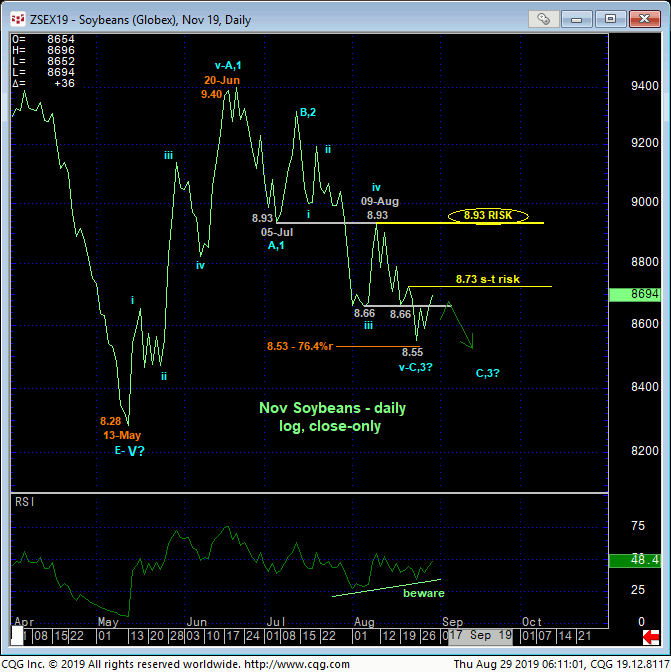
Moving out to a daily basis, both the bar chart above and close-only chart below shows the clear and present trend to be down. No question. On this scale, commensurately larger-degree strength above 13-Aug’s 8.97 larger-degree corrective high and/or 09-Aug’s 8.93 corrective high close is required to confirm a bullish divergence in momentum on a scale sufficient to not only break the 2-month downtrend, but contribute to a base/reversal count that contends Jun-Aug’s relapse is a mere correction of May-Jun’s initial counter-trend rally ahead of a resumption of that rally.
IF this relapse from the Jun high is not a correction within a major base/reversal count, then the only other thing it could be is a resumption of the secular bear trend to new lows below 7.91. And per such a bearish count we would expect the bear to provide increasingly obvious, trendy, impulsive behavior down at some point. Its inability to sustain losses below 8.70 and then 8.82 and certainly 8.97 would not only NOT be consistent with such a broader bearish count, but would reinforce our long-term base/reversal count to eventual new highs above 9.50. So the litmus test/risk parameters for the bear have been clearly identified.
The daily chart above shows yesterday’s “outside day up” (lower low, higher high and higher close than Tue’s range and close) that doesn’t hurt a bullish count, but traders are reminded that such outside days are minor indicators at best and should be taken with a grain of salt. But it’s not unusual to look back at such a minor indicator as an embryonic start to a much broader base/reversal pattern.
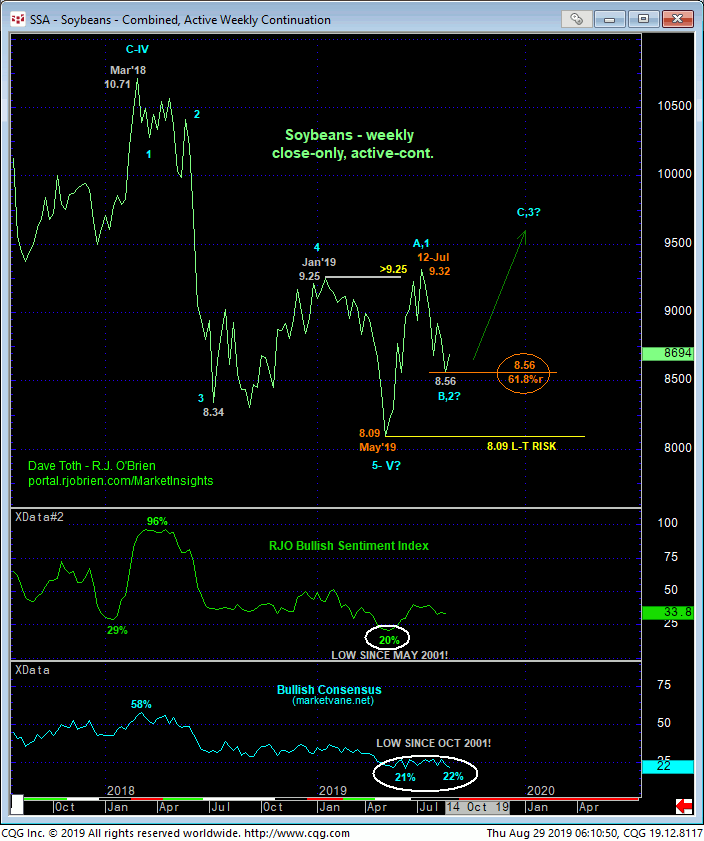
The most indicting base/reversal-threat evidence still stems from longer-term charts like the weekly close-only chart below. This evidence includes:
- Jun/Jul’s
confirmed bullish divergence in long-term momentum that, in fact, breaks
the major bear trend from at least Mar’18’s 10.71 high
- This momentum fact defines May’s 8.09 low weekly close (7.91 on an intra-day basis) as THE KEY long-term risk parameter the market needs to break to negate our long-term base/reversal count)
- Last Fri’s 8.56 low close that is the EXACT 61.8% retrace of May-Jul’s 8.09 – 9.32 rally and, most critically,
- Recent and current sentiment/contrary opinion levels that are the lowest since 2001!
Such historically bearish sentiment conditions have warned of an accompanied virtually every major base/reversal environment in any market that one wants to consider. And indeed, it’s not hard at all currently to find the headline hyperbole that’s driving the huddled masses to be as bearish this market as at any time since 2001. We would remind traders once again however that sentiment/contrary opinion is not an applicable technical tool in the absence of an accompanying confirmed bullish divergence in momentum needed to stem the clear and present uptrend. Herein lies the importance of 13-Aug’s 8.97 larger-degree corrective high and key bear risk parameter. As long as the market sustains recent the losses and downtrend, this historical sentiment condition doesn’t matter. It will not inhibit further and possibly steep, accelerated losses. BUT IF this market starts recouping admittedly shorter-term corrective highs like 8.70 and 8.82, that’d be the first indication of upside vulnerability. A recovery above 8.97 will confirm the base/reversal count and expose potentially shocking (at least to the current bearish huddled masses) gains thereafter.
Finally and as we’ve discussed often since 14-May’s bullish divergence in daily momentum led to Jun’s bullish divergence in monthly momentum below, we believe that the base/reversal-threat price action from Nov’15’s 8.44 low to be virtually identical to that that followed Jul’99’s 4.05 low. The past couple months’ “extensive” relapse is a fully-expected component within such a base/reversal process. But if this count is correct, then we would also fully expect this market to arrest this relapse with a bullish divergence in momentum somewhere between spot and May’s 7.91 low. And we will gauge this divergence around 13-Aug’s 8.97 corrective high.
Per such a long-term base/reversal-threat environment, it remains pertinent to us that the secular bear market from Sep’12’s 17.89 high to May’s 7.91 low spanned a similar length (i.e. 1.000 progression) to ALL of the previous major sell-offs over the past 20 years. The 2012 – 2019 bear lost 55.8% while all the previous declines were 53% or 54%. This Fibonacci fact means nothing if the current 2-month downtrend accelerates and eventually breaks to new lows below 7.91. BUT IF we see a recovery above 8.97 that contributes to our base/reversal count, such evidence could be the early building blocks to a multi-YEAR reversal to 12.00+.
These issues considered, a bearish policy and exposure remain advised. Very short-term strength above Mon’s 8.70 high will confirm a bullish divergence in very short-term momentum that will provides short-term traders the opportunity to neutralize bearish exposure and considered even cautious bullish exposure with a failure below 8.52 required to negate this specific call and reinstate the bear. Iterative strength above 8.82 and then certainly 8.97 will reinforce and then confirm a base/reversal count that would warrant even long-term players’ transition from a bearish camp to a bullish one.
