JUL SOYBEAN MEAL
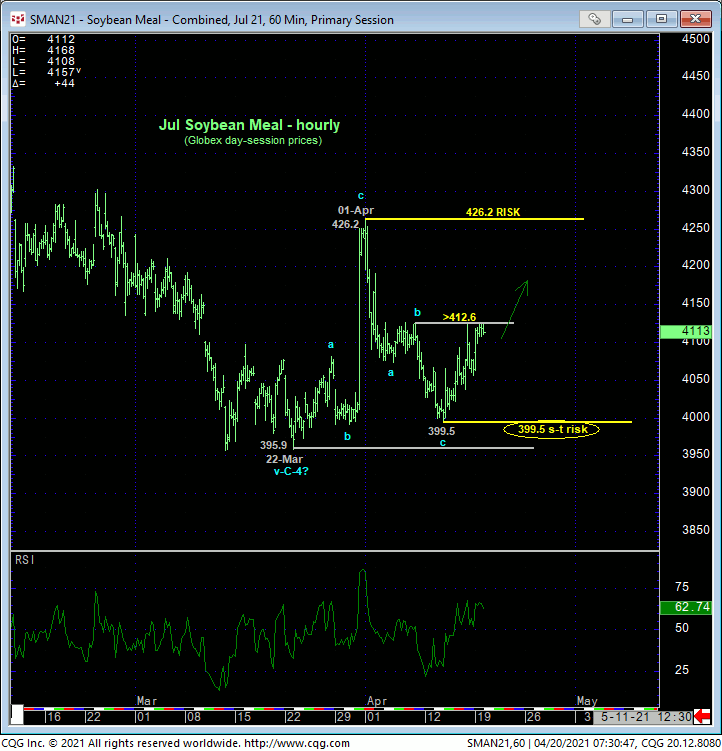
While the hourly chart of Globex day-session prices below does not yet reflect it, overnight prices have the Jul contract trading above 09-Apr’s 412.6 high. This renders the sell-off attempt from 01-Apr’s 426.2 high a 3-wave affair as labeled above. Until and unless negated by a relapse below 13-Apr’s 399.5 low, this 3-wave setback may be considered a corrective/consolidative affair that warns of a resumption of late-Mar’s rally that preceded it to new highs above 426.2, our key longer-term bear risk parameter. In effect, it’s easy to see in the hourly chart that the market has identified a recent range defined by 426.2 and 22-Mar’s 395.9 low, a key low that will likely be broken if the market fails below our new short-term risk parameter at 399.5.
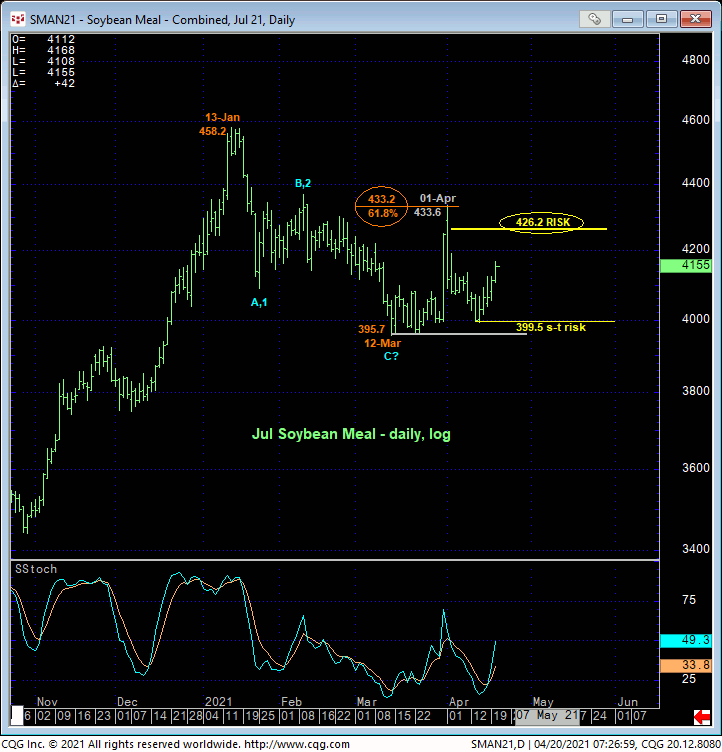
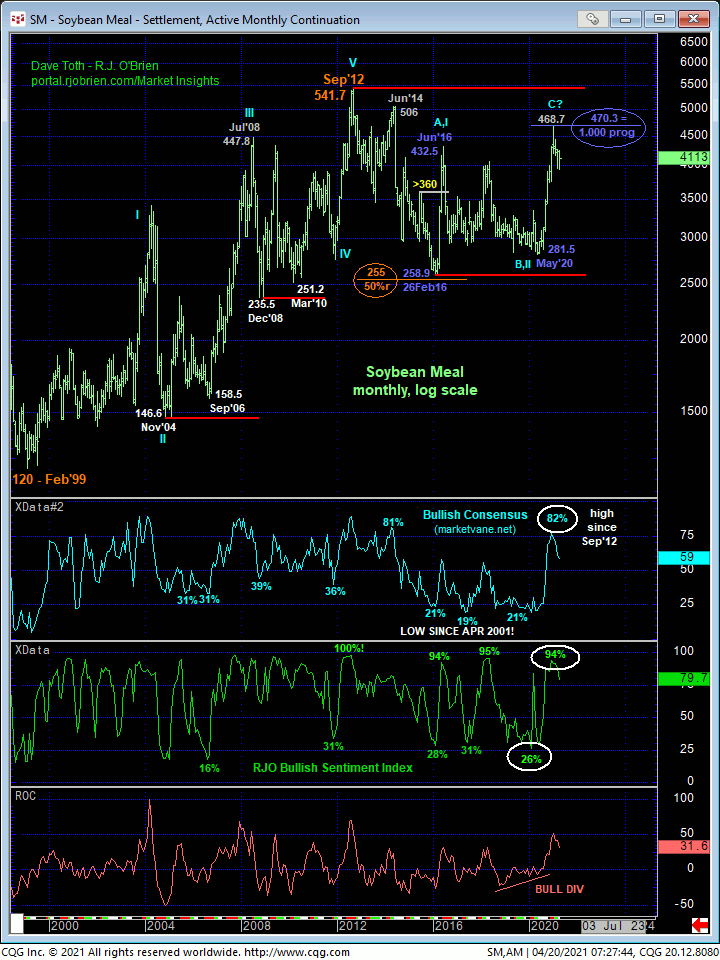
The market’s ability to recoup 01-Apr’s 426.2 high is important from a longer-term perspective because it would reinforce a broader bullish count stemming from what thus far is only a 3-wave decline from 13-Jan’s 458.2 high to 12-Mar’s 395.7 low shown in the daily log scale chart of the Jul contract above. Left unaltered by a relapse below 395.7 and reinforced by a recovery above 426.2, Jan-Mar’s 3-wave decline can be considered a corrective/consolidative event that warns of a resumption of the major bull trend that preceded it.
Such 426.2+ strength remains minimally required to resurrect a broader bullish count in the face of still-threatening peak/reversal evidence on a major scale:
- early-Mar’s bearish divergence in weekly momentum that broke May’20 – Jan’21’s uptrend
- a textbook complete 5-wave Elliott sequence up from May’20’s 281.5 low
- historically frothy bullish sentiment/contrary opinion levels not seen since at least 2018 and, in the case of the Bullish Consensus (marketvane.net), since 2012
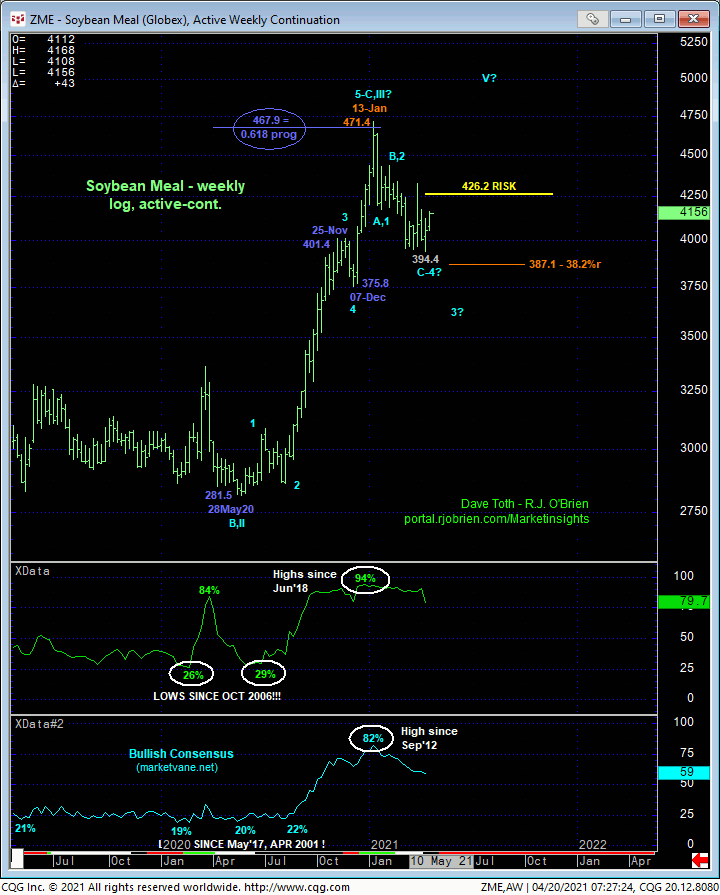
- the market’s recent return to the upper-quarter of its 8-1/2-year range where
- the rally from May’20’s 281.5 low spanned an exact length (i.e. 1.000 progression) to 2016’s preceding 258.9 – 432.5 rally.
On an active-continuation basis, even if the market recouped 426.2, it would remain a goodly distance shy of Jan’s 471.4 high, maintaining a peak/reversal threat that could be major in scope.
These issues considered, traders are advised to toggle directional biases and exposure around this month’s 399.5 and 426.2 boundaries commensurate with their personal risk profiles (i.e. cautious bullish policy for shorter-term traders with a failure below 399.5 negating and warranting cover; bearish policy for longer-term commercial players with a recovery above 426.2 negating and warranting cover).
DEC SOYBEAN MEAL
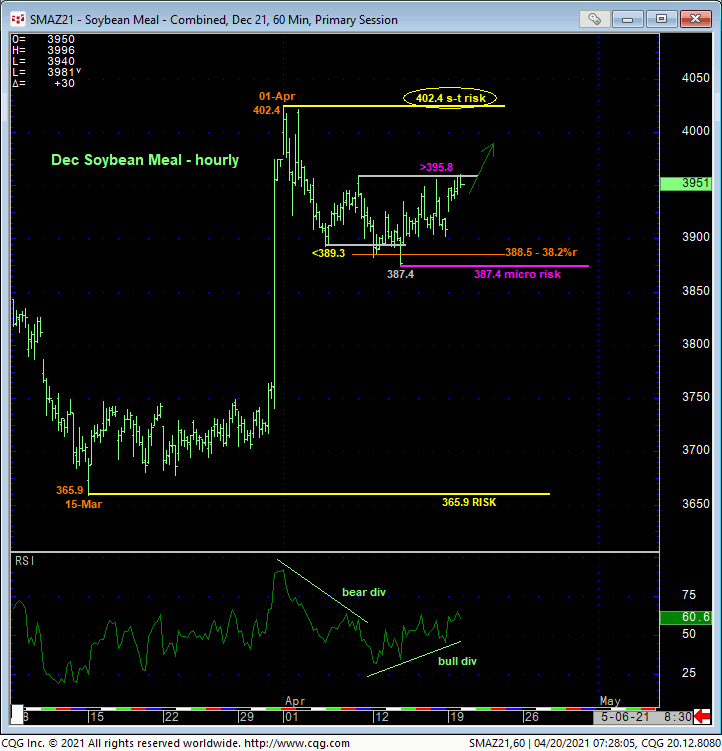
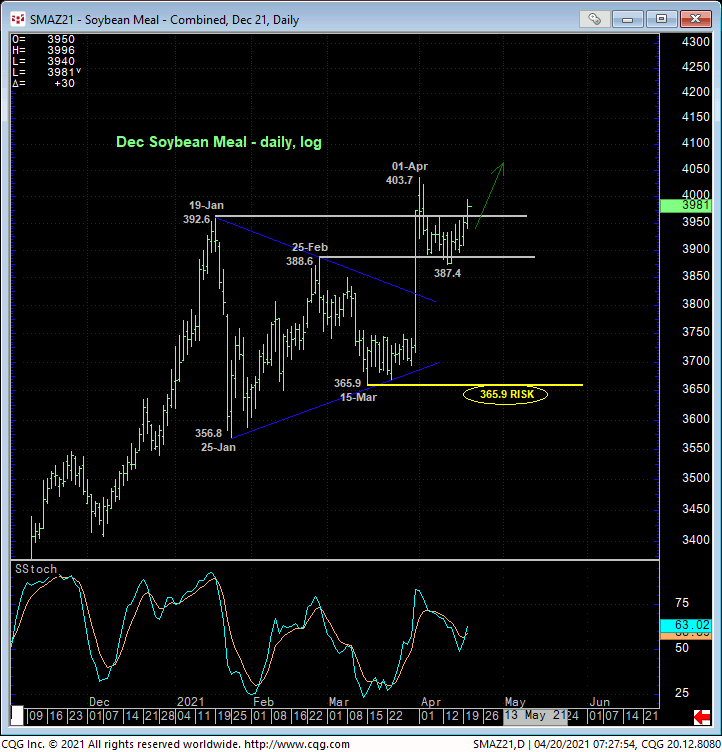
We discussed in 14-Apr’s Technical Webcast the need for the dec contract to “hold” somewhere around the 390-area former resistance-turned-support for the relapse from 01-Apr’s 402.4 high to be considered a smaller-degree correction within the resumed major uptrend. Overnight’s recovery above 09-Apr’s 395.8 minor corrective high confirms the bullish divergence in very short-term momentum necessary to identify 13-Apr’s 387.4 low as one of developing importance and our micro risk parameter from which bullish punts can be objectively based and managed. The market stemming this relapse around the (388.5) Fibonacci minimum 38.2% retrace of Mar-Apr’s 365.9 – 402.2 rally would seem to reinforce this bullish count. This said, 01-Apr’s 402.4 high and resistance remains intact as THE level the market still needs to recoup to reinstate the major bull.
From a long-term perspective, the technical construct looks constructive following 31-Mar’s resumption of the major uptrend and the market thus far holding former 390-area resistance-turned-support. On this broader scale, a failure below 15-Mar’s 365.9 larger-degree corrective low is required to confirm a bearish divergence in momentum of a sufficient scale to, in fact, break the major bull trend in the Dec contract.
These issues considered, a bullish policy and exposure remain advised for long-term commercial players with a failure below 365.9 required to negate this call and warrant its cover. Shorter-term traders with tighter risk profiles are advised to return to a bullish policy and first approach dips to 393 OB as corrective buying opportunities with a failure below 387.4 required to negate this specific call and warrant its cover. In lieu of such sub-387.4 weakness, further and possibly accelerated gains straight away should not surprise.
