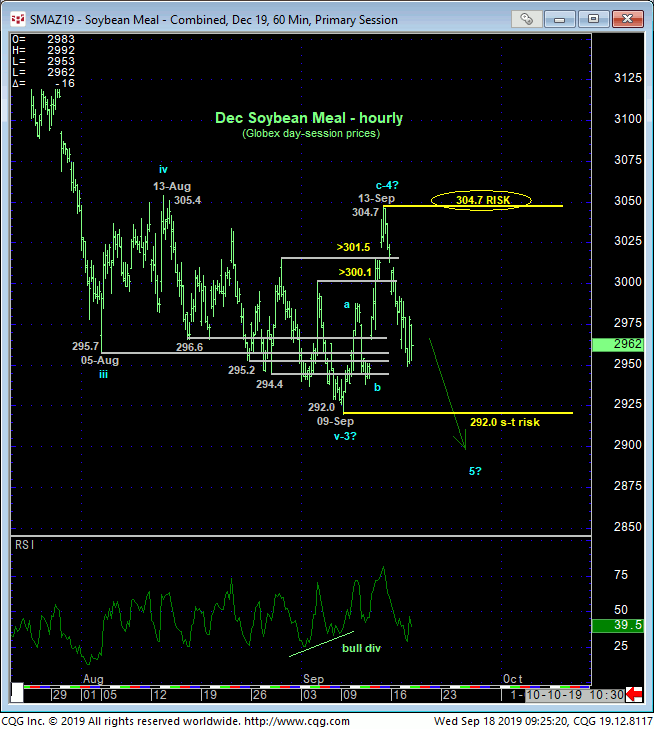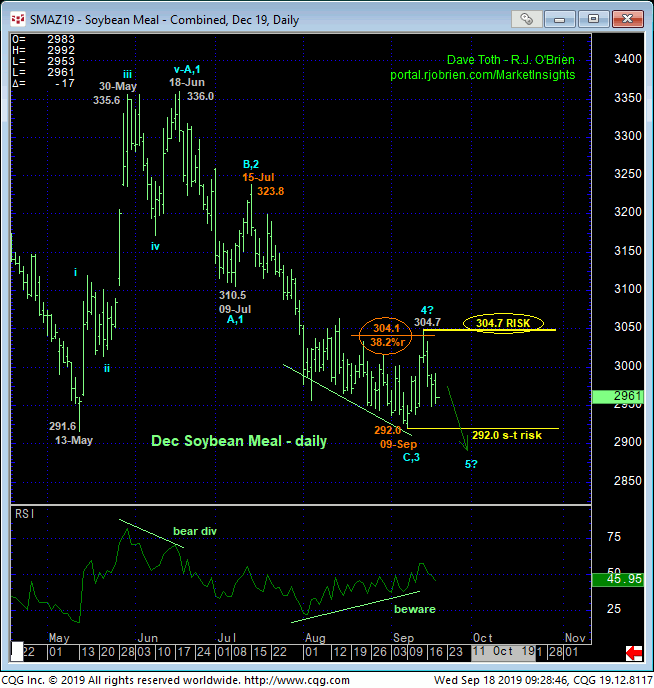
Since late-Aug/early-Sep’s resumption of the summer swoon, we’ve had 13-Aug’s 305.4 corrective high as our longer-term risk parameter to what we still believe is just an interim bearish count. As a result of the extent of this week’s relapse detailed in the hourly chart below, we’re considering Fri’s 304.7 high as our new longer-term risk parameter to a bearish policy for longer-term players. While 09-Sep’s 292.0 low remains intact however, it remains as an objective shorter-term risk parameter the market still needs to break to mitigate any base/correction/reversal threat and reinstate the 3-month downtrend. In effect, we believe the market has identified 292 and 304.7 as the key directional triggers heading forward.

There are three reasons we believe Fri’s 304.7 high serves as a relatively tight but key longer-term risk parameter to a continued bearish policy by longer-term players:
- simply the broader 3-month downtrend as a backdrop
- the 3-wave and thus corrective sub-division of the 292 – 304.7 recovery as labeled in the hourly chart above and
- the market’s respect thus far for the (304.1) 38.2% retrace of Jul-Sep’s (prospective 3rd-Wave) decline from 323.8 to 292.0 as shown in the daily chart below.
IF the 3-month downtrend is still intact, it needs to sustain levels below 304.7. Its failure to do so will confirm a bullish divergence in momentum, break this downtrend and exposure a base/reversal threat that we believe could be major in scope and warrant an immediate switch to a new and aggressive bullish policy.

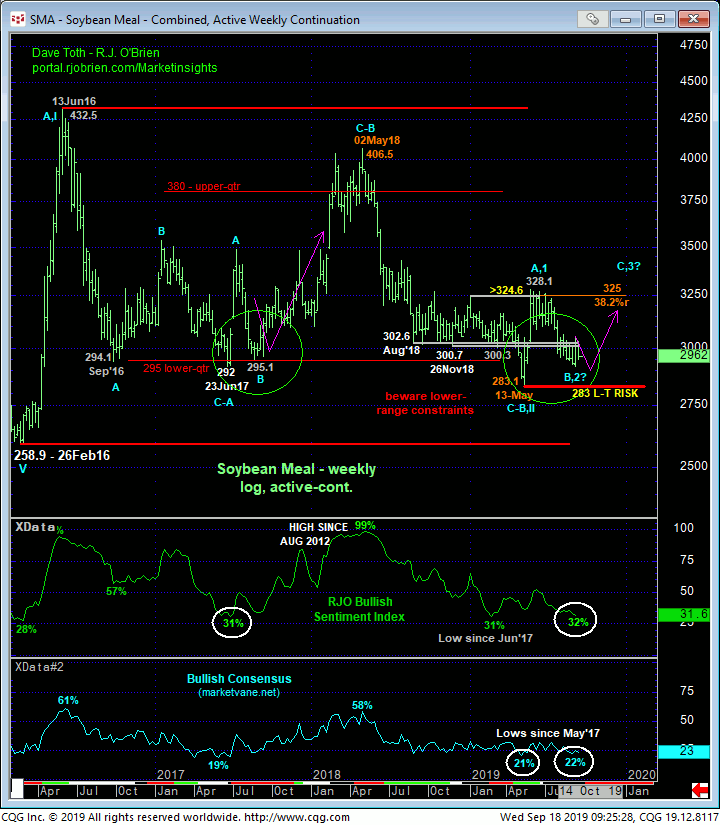
We made reference to an “interim” bearish count above because we believe that on a major, long-term basis, this summer’s slide is just a corrective retest of May’s 283.1 low within an even broader, multi-year base/reversal process from Feb’16’s 258.9 low shown in the weekly log active-continuation chart below. Integral to this long-term bullish count are the:
- market’s continued respect for and rejection of the lower-quarter of the multi-year lateral range
- May-Jun’s bullish divergence in MONTHLY momentum that, in fact, broke May’18 – May’19’s major bear trend
- base/reversal-threat behavior that thus far is virtually identical to Jun-Aug’17’s base/reversal circled in green below and, most indicting,
- still historically bearish sentiment/contrary opinion levels that have warned of and accompanied every past major base/reversal.
If this long-term base/reversal count is wrong, all the bear has to do is, at least, break May’s 283.1 low that serves as our major long-term risk parameter. This said, traders are reminded that sentiment/contrary opinion is not an applicable technical tool until an accompanying bullish divergence in momentum breaks the downtrend. Herein lies the crucial importance of Fri’s 304.7 high as a relative tight but key risk parameter to bearish exposure “down here”.
These issues considered and even though 09-Sep’s 292.0 low and short-term risk parameter remains intact, shorter-term traders are advised to maintain or move to a neutral-to-cautiously-bearish policy with a recovery above 304.7 required to reverse into a new bullish policy. Long-term players remain advised to maintain a bearish policy with a recovery above 304.7 required to reverse into a new bullish policy. In lieu of such 304.7+ strength, a resumption of the 3-month downtrend to new lows below 292.0 should not surprise. Whether such a sub-292.0 break continues on to break that key 283.1 low however will be interesting to see.


