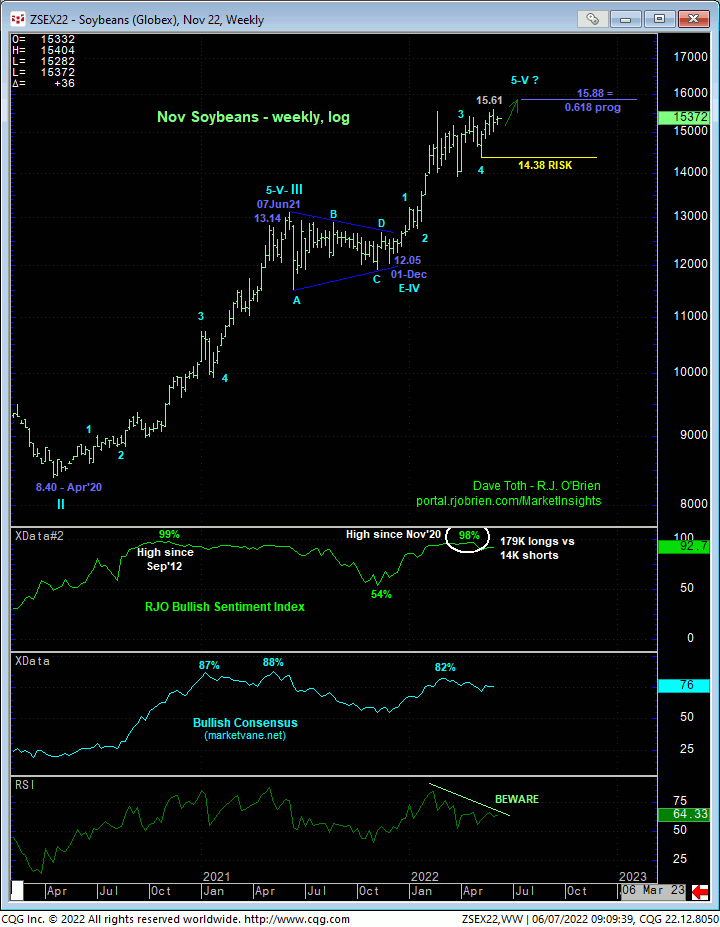
As most recently updated in 26-May’s Technical Blog, the Nov contract has yet to provide even the minimum evidence necessary to even defer, let alone threaten its secular bull trend. A failure below at least 31-May’s 15.06 Globex day-session low is minimally required to render that level an initial counter-trend low and confirm a bearish divergence in daily momentum. But the scale of such a mo failure would only be sufficient to conclude the end of the portion of the secular bull trend from 09-May’s 14.38 next larger-degree corrective low and key long-term bull risk parameter. Until this market fails below at least 15.06, the longer-term trend remains up and should not surprise by its continuance or acceleration.

Indeed, on a scale sufficient to break even the portion of the secular bull trend from 01Dec21’s 12.05 low, let alone suggest the monster TWO YEAR bull trend might be over, commensurately larger-degree weakness below at least 09-May’s 14.38 larger-degree corrective low remains minimally required. And even then, such a sub-14.38 failure might only satisfy the first two of our three key reversal requirements. A subsequent and potentially extensive (B- or 2nd-wave) corrective rebuttal to that initial (A- or 1st-wave) decline could follow, exposing a peak/reversal PROCESS that could span months.
These issues considered, a bullish policy and exposure remain advised with a failure below 15.06 required for shorter-term traders to move to a neutral/sideline position and for longer-term commercial players to pare bullish exposure to more conservative levels. In lieu of such weakness, further and possibly accelerated gains should not surprise. Against this backdrop and heading into Fr’s key crop report, please see a cautious bear hedge strategy for producers and a cautious bullish strategy for speculators below.

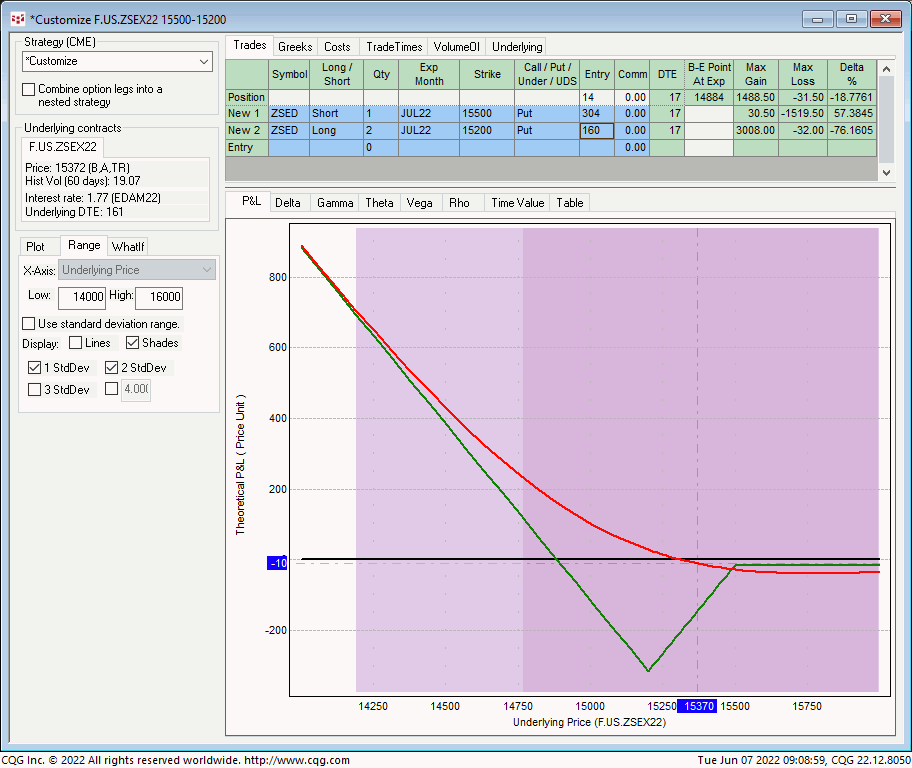
PRODUCER BEAR HEDGE: JUL SHORT-DATED 15.50 – 15.20 PUT BACKSPREAD
UNlike the corn market that has established some specific highs and resistance resulting from confirmed momentum failures from which the risk/cost of a more aggressive bear hedge strategy can be objectively structured and managed, the still-arguable secular bull market in beans requires any bear hedge to be more conservative at this point with minimal/limited risk/cost on the likely continuation of the major bull trend. The Jul Short-Dated 15.50 – 15.20 Put Back Spread provides these elements.
This strategy involves selling 1-unit of the Jul SD 15.50 Puts around 30-1/2-cents and buying 2-units of the Jul SD 15.20 Puts around 16-cents for a net initial cost of about 1-1/2-cents. This strategy provides:
- a current net delta of -19%
- favorable margins
- fixed, maximum and negligible risk/cost of 1-1/2-cents on ANY continuation of the major bull market above 15.50
- maximum risk/cost of 31-1/2-cents if the underlying Nov contract settles at 15.20 at expiration 17 days from now on 24-Jun
- virtually unlimited dollar-for-dollar downside hedge protection below its 14.88 breakeven point at expiration.
As the P&L graph below shows, this strategy is betting on a sharp MOVE AWAY FROM CURRENT LEVELS, either way, as a result of this Fri’s key crop report. In other words, the maximum risk/cost to this strategy will come from lateral, boring price action as a result of a dud report on Fri.

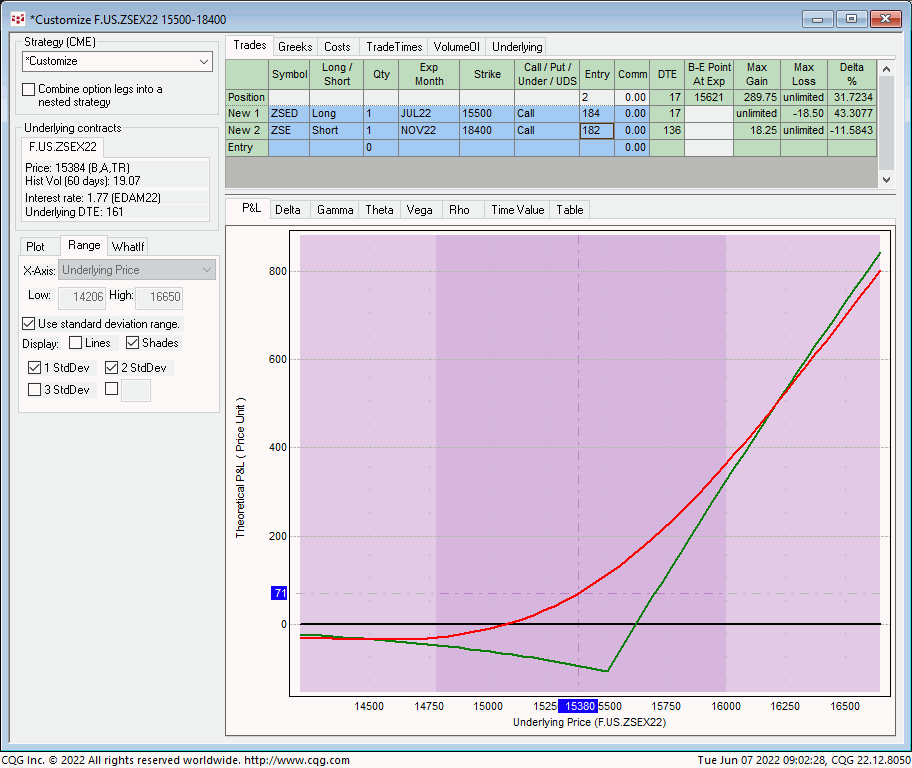
BULL SPEC: JUL SHORT-DATED 15.50 / NOV 18.40 CALL DIAGONAL
Despite the magnitude of the secular bull trend and clear bull risk parameters at 15.06 and 14.38, it’s not hard to envision a peak/reversal threat due to arguably waning upside momentum and historically frothy bullish sentiment levels. With a key crop report as an igniter to a move either way, even hardened bulls may want to opt for a more conservative yet favorable risk/reward bullish position heading into Fri’s report. The Jul Short-Dated 15.50 / Nov 18.40 Call Diagonal Spread provides exactly the ticket.
This strategy involves buying the Jul SD 15.50 Calls for around 18-1/2-cents and selling the Nov 18.40 Calls for around 18-1/4-cents for an initial cost of about 1/4-cent. This strategy provides:
- a current net delta of +32%
- a whopping 7:1 gamma ratio
- favorable margins
- negligible risk if the market collapses following a momentum failure below 15.06 on a bearish report
- profit potential of nearly $3.00 on a sustained continuation of the secular bull trend.
Indeed, it would not take much more of a rally in the underlying Nov contract for the Jul SD 15.50 calls to begin to behave like an aggressive long futures position. This is the result of the huge gamma advantage this Jul SD call enjoys over a far-out-of-the-money Nov call that doesn’t expire for 136 days.
The biggest threat to such long-gamma diagonal strategies is time decay, or theta, resulting from market INactivity. Theoretically, the long call can erode to zero over the next 17 days from lateral, sideways market action, leaving an eventual naked short position in the Nov 18.40 calls that would expose infinite risk. But we NEVER let such a strategy erode to this condition. This strategy is a BET ON A MAJOR MOVE EITHER WAY. If the underlying Nov contract explodes higher, this strategy will profit handsomely. If the market tanks, the risk/cost to this diagonal spread is negligible. If Fri’s report is a complete dud and the Nov contract remains within its recent 15.00 – 15.50-range into mid-next-week, this strategy should be covered for what should be a small loss.
Please contact your RJO representative for updated bid/offer quotes on these option strategies.


