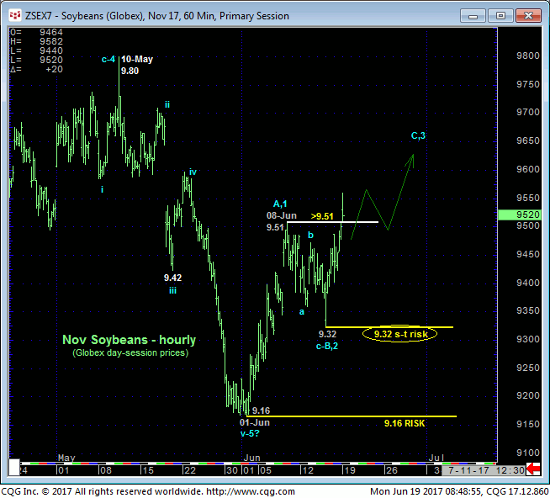
In 09-Jun’s Technical Blog following 08-Jun’s bullish divergence in short-term momentum in the Nov contract, we discussed the need for further proof of 3-wave, corrective behavior on a subsequent relapse attempt likely before the key 30-Jun crop report to satisfy the critical third of our three reversal requirements. With this morning’s recovery above 08-Jun’s 9.51 initial count-trend high the market has done exactly this, rending the interim sell-off attempt from 9.51 to Thur’s 9.32 low a 3-wave and thus corrective affair as labeled in the hourly chart below.
Today’s resumed strength, in fact, confirms AT LEAST the intermediate-term trend as up. Most importantly the market has now identified TWO specific, objectively lows at 9.32 and 9.16 from which the risk of a new bullish policy and exposure can be objectively based and managed ahead of a move higher that we believe could shock the huddled masses and their decisive BEARISH view.


The MAJOR BASE/reversal-threat environment is a compelling and opportunistic one predicated on a number of technical facts, including:
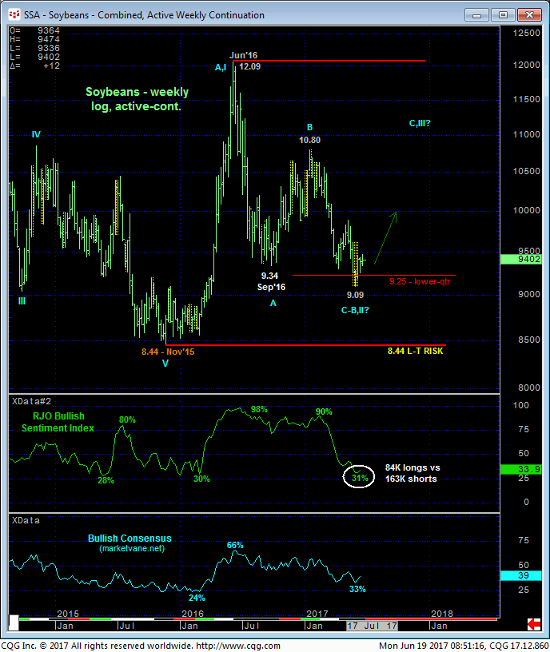
- the market’s rejection thus far of the lower-quarter of the 2-1/2-YEAR range shown in the weekly log active-continuation chart below
- historically bearish sentiment that has warned of and accompanied virtually every major base/reversal in the past
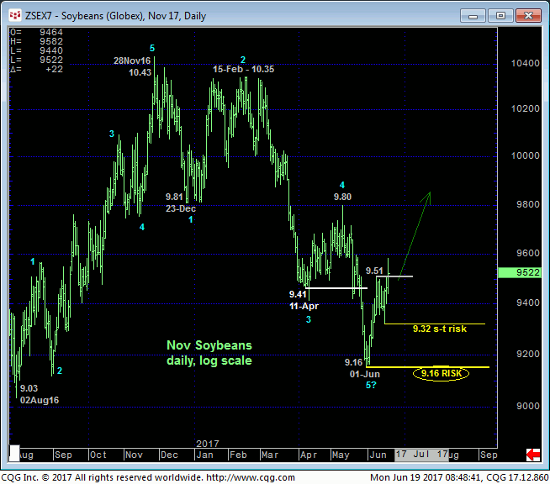
- an arguably complete 5-wave Elliott sequence down from 28Nov16’s 10.43 low labeled in the daily log scale chart above and, of course,
- today’s bullish divergence in momentum above 9.51 that clearly exposes the new longer-term trend as up and identifies two specific levels the market is now required to fail below to threaten and then negate a new bullish count.


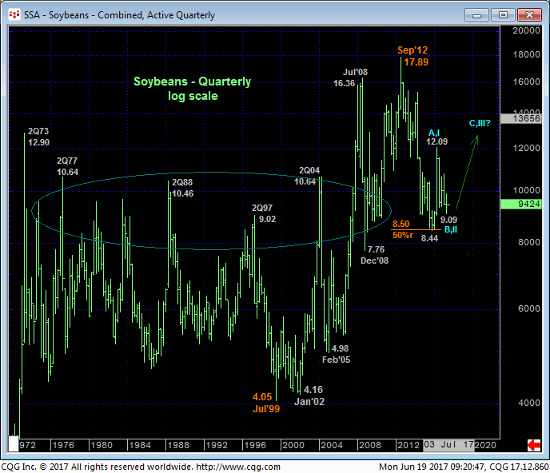
On a massive 40-year basis shown in the quarterly log scale chart below, we discussed three years ago during 2014’s meltdown the prospect that the 9.00-to-10.00-range that arguably capped 35 years of price action as resistance should be approached as a huge and general support candidate. Nov’15’s 8.44 low and exact 50% retrace of the secular bull from Jul 1999’s 4.05 low to Sep’12’s 17.89 all-time high became the acute low and long-term support level and risk parameter only after Mar/Apr 2016’s confirmed bullish divergence in momentum BROKE the 3-year bear trend and exposed the major base/reversal count.
That major base/reversal count not only remains intact, following what arguably is a COMPLETE 3-wave and thus corrective (B- or 2nd-Wave) relapse from Jun’16’s 12.09 high, this market may now be poised for a (C- or 3rd-Wave) rally of the same or greater magnitude and mannerisms as Nov’15 – Jun’16’s rally. And without ever dipping below 9.16 and maybe even 9.32.
As we’ve discussed often, the past year’s relapse from Jun’16’s 12.09 low falls well within the bounds of a 3-wave correction within a major base/reversal environment similar to those major base/reversal environments between 2008 and 2010 and between Feb’05 and Sep’06 circled in blue in the monthly log scale chart above. Contributing to the very compelling and opportunistic nature of this base/reversal count is the Fibonacci fact that the decline from Sep’12’s 17.89 high is virtually identical in length (i.e. 1.000 progression) to BOTH the 2008 and 2004-05 declines. Combined with the huddled masses being historically bearish (typical of most major bottoms), a complete wave count down and a bullish divergence in momentum that has stemmed this year’s slide and identified specific and objective risk parameters, we believe an acute and potentially monstrous risk/reward buying is being presented.
These issues considered, traders are advised to move to a new bullish policy and exposure on a scale-down from at-the-market (9.53) to 9.48 with protective sell-stops just below 9.32 and/or 9.16 depending on one’s personal risk profile. Technically we believe this to be an acute and objective risk/reward opportunity for end-users to establish bull hedges for a move that could span months or even quarters and ultimately break 2016’s 12.09 high. Producers also have the opportunity to pare or cover bear hedges until and unless the market relapses below at least 9.32 and preferably 9.16.


