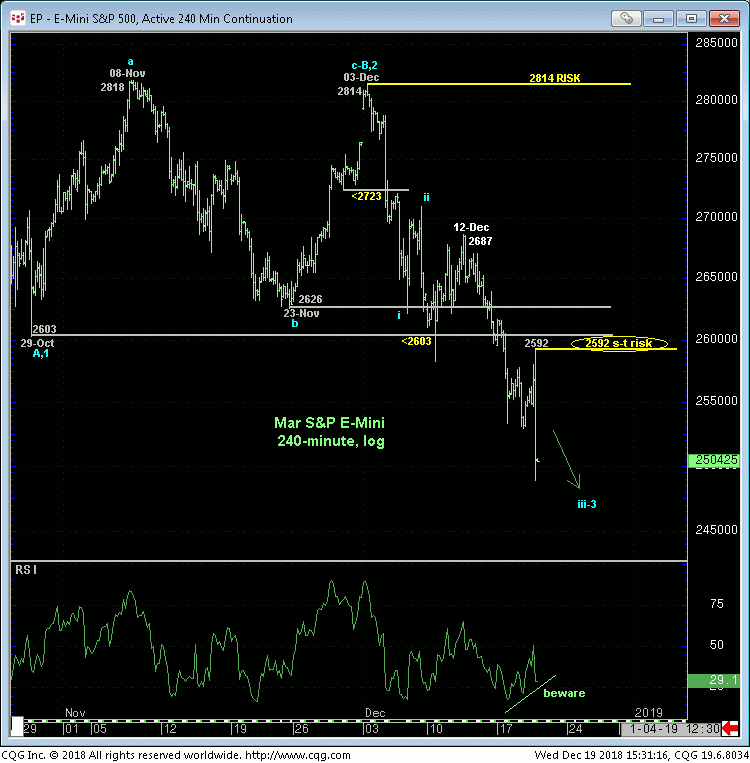
Today’s “outside day down” obviously reinforces our bearish count introduced in 06-Dec’s Technical Blog that warns of potentially protracted losses straight away. An important by-product of today’s continued decline is the market’s definition of today’s 2592 high as the latest smaller-degree corrective high this market is now minimally required to recover above to even defer, let alone threaten this bearish count. Per such we are identifying this 2592 high as our new short-term risk parameter from which a bearish policy and exposure can be objectively rebased and managed by shorter-term traders with tighter risk profiles.


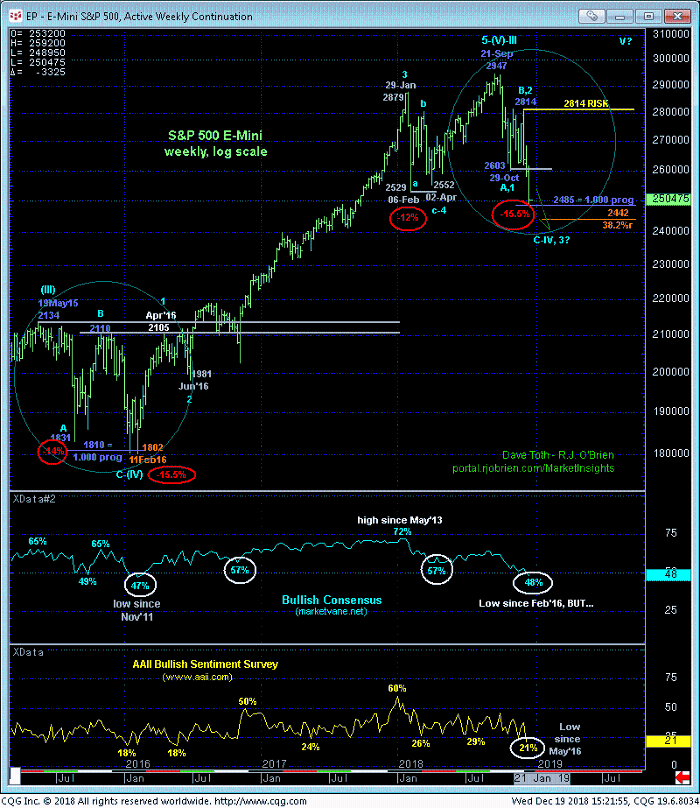
This tight but objective risk parameter at 2592 may come in handy because with today’s continued losses the entire decline thus far from 21-sep’s 2947 all-time high as spanned an exact length (i.e. 1.000 progression) to May’15 – Feb’16’s 15.5% correction from 2134 to 1802. While this Fibonacci progression relationship is interesting, it is also “derived” from previous levels. And long-time readers of our blog know of our disdain for RELYING on such derived levels as trend lines, Bollinger Bands, imokus, the ever-useless moving averages and even the vaunted Fib relationships we cite often in our analysis. ALL of such derived levels NEVER have proven to be reliable reasons to identify support (or resistance) without an accompanying momentum failure needed to stem the clear and present trend. And they NEVER will.
Herein lies the importance of the market’s ability to prove “non-weakness” by recovering above a prior corrective high like 03-Dec’s 2814 larger-degree corrective high and key risk parameter and even an admittedly minor corrective high like 2592. And until such strength is shown, the trend remains down on all scales and should not surprise by its continuance or acceleration.
The weekly log chart below also shows historically deteriorated sentiment levels that are typical of major BASE/reversal conditions. We have no doubt that such bearishness will contribute mightily to a base/reversal condition and tremendous buying opportunity that could span the long-term BUT traders are reminded that sentiment/contrary opinion is not an applicabletechnical tool in the absence of a downtrend-countering bullish divergence in momentum.

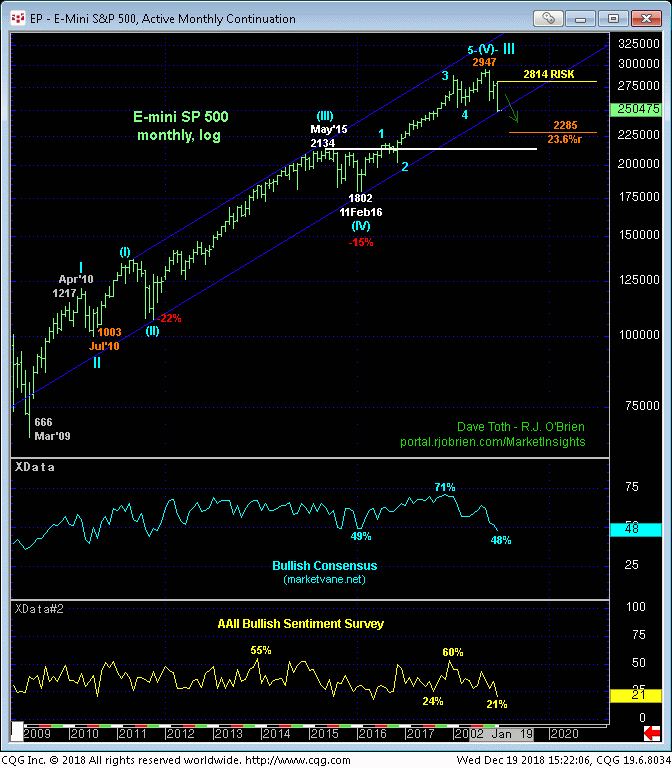
Finally, the real challenge here is trying to discern what previous uptrend the current correction is correcting. It’d be easy and hopeful to conclude that the past quarter’s swoon was “only” correcting the portion of the secular bull from Feb’16’s 1802 low to this year’s 2947 high. Under such a possibility we’d be watching closely for a downtrend-countering momentum failure right around current levels.
But of course there is no such crystal ball and for all we know this market is on the precipice of correcting the broader 5-wave Elliott sequence from Jul’10’s 1003 low. And if THIS is the case, then we could easily be looking at multi-month or multi-quarter weakness and vulnerability to the 2100-area of former resistance-turned-support from 2015.
The bottom line is that the market has broken all support levels of any pertinence and exposed a chasm totally devoid of any technical levels of merit below it. The ONLY levels of any technical merit now only exist ABOVE the market in the form of former support-turned-resistance like the 2603-to-2626-area and prior corrective highs like 2592 and 2814. And until the market can recover above these levels and requirements, the trend is down on all scales and should bnot surprise by its continuance or acceleration.
In sum, a bearish policy and exposure remain advised with a recovery above 2592 required for shorter-term traders to move to the sidelines and for longer-term players to pare bearish exposure to more conservative levels. In lieu of such strength the market’s downside potential remains indeterminable and potentially severe straight way.


