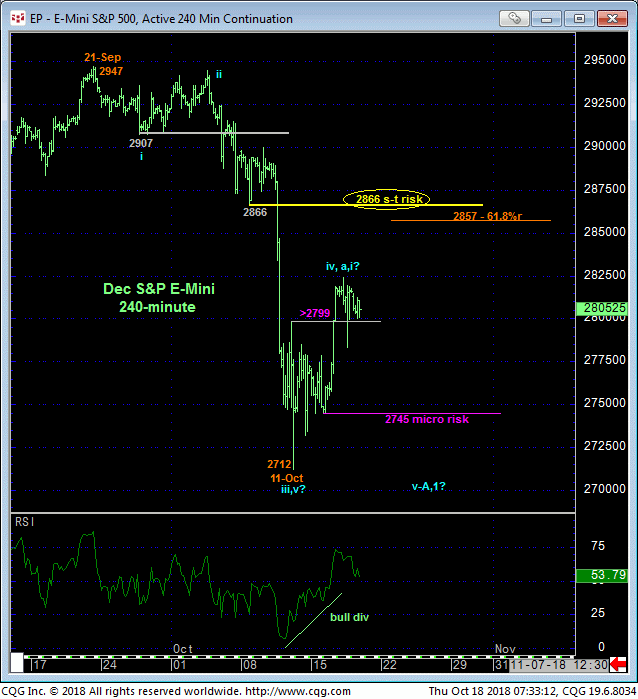
In our past couple updates and in Mon’s Technical Blog most recently, we discussed the likelihood of a potentially extensive corrective rebuttal to early-Oct’s relative collapse and identified 11-Oct’s 2799 high as a micro risk parameter the market needed to recoup to possibly expose that rebound. The 240-min chart below shows Tue afternoon’s recovery above this 2799 threshold, but because of the magnitude of the decline that preceded it, it’s indeterminable at this point whether this rebound is part of that more extensive correction back up or just an interim (4th-Wave) pop before the resumption of the decline and wave sequence from 21-Sep’s 2947 high to another round of new lows. Because of this debate and unknown and in the interest of keeping some powder dry for a preferred risk/reward opportunity, a neutral/sideline position remains advised for the time being.

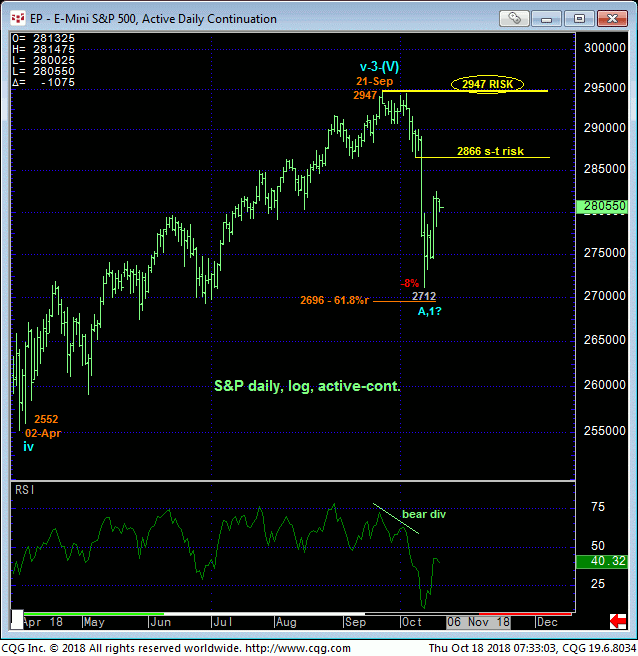
08-Sep’s 2866 low remains intact as our short-term risk parameter the market still needs to recoup to negate the impulsive integrity of a more immediate bearish count. This risk parameter however is just a stone’s throw from the (2857) 61.8% retrace of Sep-Oct’s 2947 – 2712 plunge and our “gauge” for a “more extensive” correction to the recent decline. So at the same time that the market would arguably be negating the impulsive decline from the Sep high, it could be nearing its (B- or 2nd-Wave) corrective rebound high that, stemmed by a bearish divergence in short-term mo, could be presenting a terrific risk/reward selling opportunity.

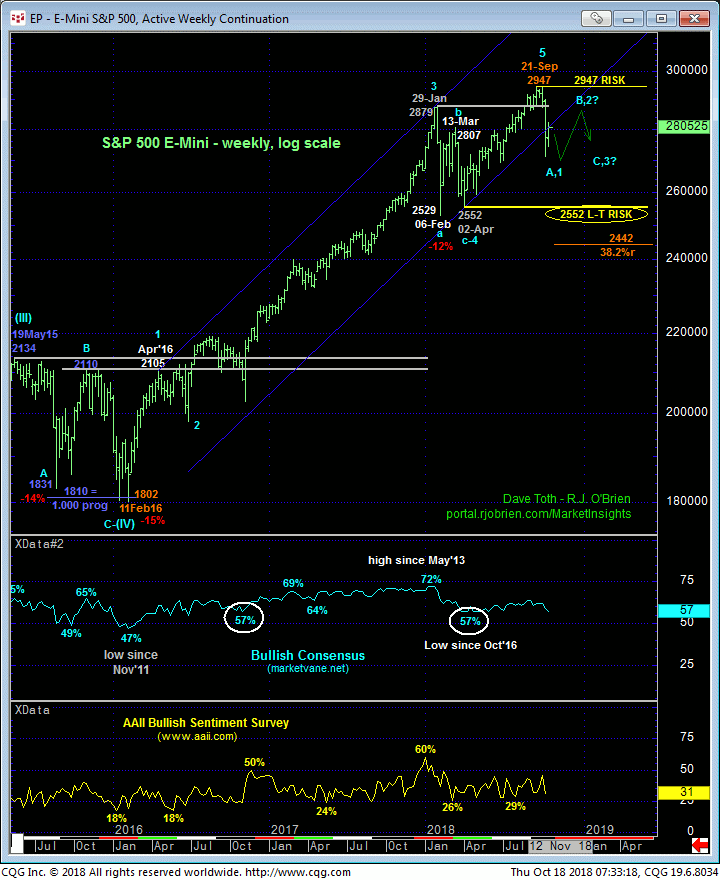
From a much longer-term perspective, the extent and impulsiveness of the decline from 21-Sep’s 2947 high is not unimpressive. Only a glance at the weekly log chart below is needed to see that it’s one of the more notable setbacks over the past three years and has the potential to evolve into an even more protracted correction lower IF it rolls over once again on a retest of the Sep high in the weeks ahead. Indeed and as labeled below, Apr-Sep’s portion of the bull from 2552 to 2947 cannot be ignored as the prospective completing 5th-Wave of an Elliott sequence that began from 11Feb16’s 1802 low.
If this is a correct count, a multi-month or even multi-quarter correction could lie ahead, requiring a recovery above 21-Sep’s 2947 high and key long-term risk parameter to negate that count. Much has to unfold with respect to a much broader peak/correction/reversal environment before we start speculating on downside potential, but Fibonacci retracement and progression relationships would range from 2589 to 2442 and could span until next Jun or Sep.
These issues considered, a neutral/sideline policy remains advised for the time being. A relapse below Mon afternoon’s 2745 low and micro risk parameter will confirm this week’s recovery as a corrective affair and resurrect Sep-Oct’s decline. The more the market continues to recovery in the days immediately ahead, focus will shift to that “more extensive” B- or 2nd-Wave correction of the 2947 – 2712 decline and the all-important bearish divergence in momentum from levels around or above the (2857) 61.8% retrace of Sep-Oct’s plunge that could provide a critical and acute risk/reward condition from which to adjust/protect equity portfolios for quite a while.


