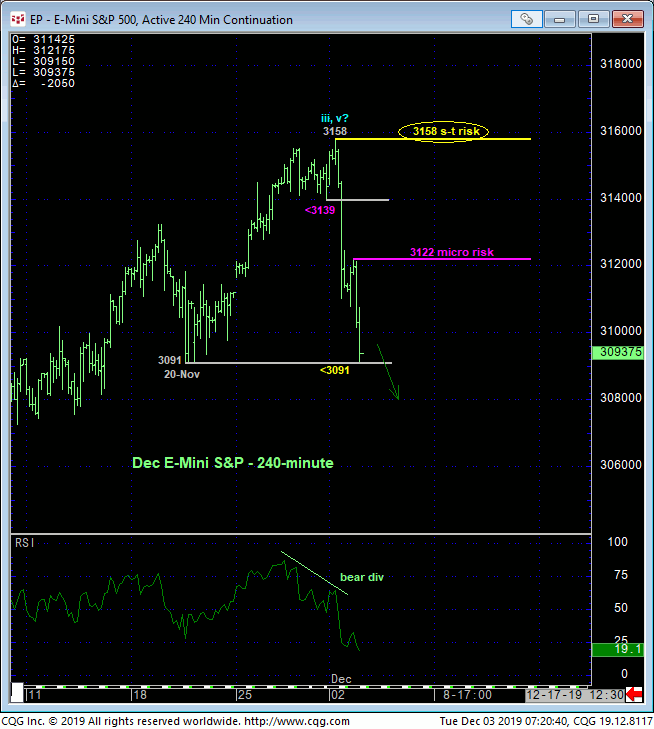
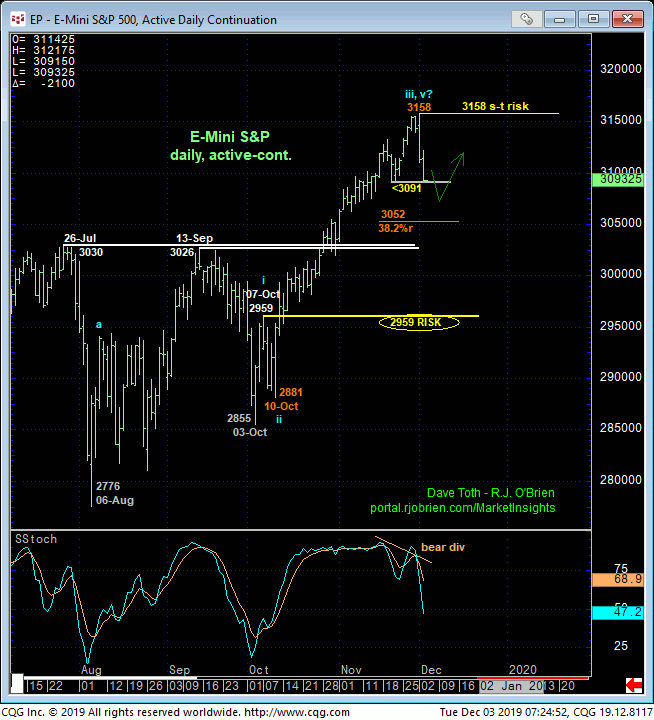
On the heels of yesterday’s bearish divergence in very short-term momentum below Fri’s 3139 minute corrective low detailed in the 240-min chart above, subsequent losses and this morning’s break below 20-Nov’s 3091 larger-degree corrective low confirms a bearish divergence in daily momentum below. This momentum failure defines yesterday’s 3158 high as one of developing importance and our new short-term risk parameter from which non-bullish decisions like long-covers and cautious bearish punts can now be objectively based and managed by shorter-term traders with tighter risk profiles. Today’s continued slide leaves today’s 3122 high in its wake as an even smaller-degree corrective high and a micro risk parameter from which non-bearish decisions can be objectively based and managed.
From a longer-term perspective however, this week’s setback is of a grossly insufficient scale however to conclude anything more than another corrective burp within the secular bull trend and eventual buying opportunity for longer-term players. Indeed and still, commensurately larger-degree weakness below at least former 3030-to-3026-area resistance-turned-support remains required to even defer, let alone threaten the secular bull market pertinent to longer-term players.
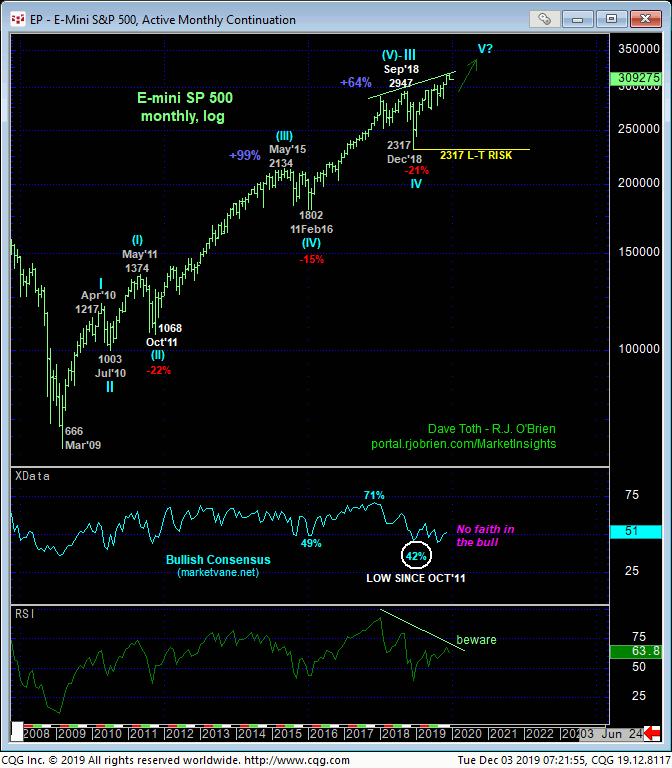
We would also add the it would be highly unusual for this market (or most others, for that matter) to present the fundamental hyperbole that warns/advises traders to “get out” literally the day of an all-time high and be rewarded for those actions. As we’ll show below, the general consensus, indicated by market sentiment/contrary opinion indicators has doubted this market since late-May and has missed over 400 points of rally. This week’s setback will only fuel further doubt, which remains a reinforcing factor for our long-term bullish count.
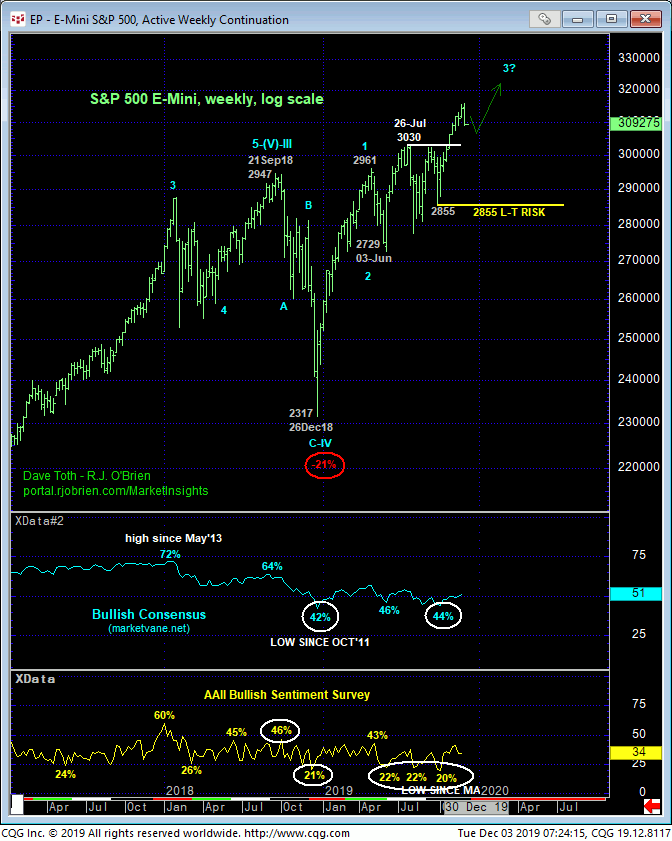
The weekly log chart above shows the Bullish Consensus (marketvane.net) and American Association of Individual Investors sentiment surveys that have been underwhelming since May-Jun’s CORRECTION. While the RATE of ascent was certainly slower between Jun and Sep, the simple uptrend pattern of higher highs and higher lows remained intact ahead of late-Oct’s more obvious reaffirmation of the secular bull market. And even over the past two weeks while the secular bull was making new all-time highs, the AAII survey ACTUALLY FELL from 41% bullish to 34% bullish.
Both these sentiment/contrary opinion indicators remain far from the frothy levels that typically warn of and accompany major peak/reversal environments. Per such, longer-term players are advised to first approach this week’s sell-off attempt as another corrective buying opportunity. We will be watchful for the relapse-stemming bullish divergence in momentum to identify a more reliable low and support from which this bullish play can be objectively based and managed. Shorter-term traders have been advised to move to a neutral/sideline position to circumvent the depths unknown of this suspected correction.
As a final thought, let’s just play the conservative devil’s advocate here and assume that yesterday’s 3158 high ended the bull and started a a major reversal lower. The market would be require to satisfy our three reversal requirements:
- a confirmed bearish divergence in momentum of a scale sufficient to break the major uptrend (today’s sub-3091 is NOT of such a scale, but…)
- proof of trendy, impulsive, 5-wave behavior on the initial counter-trend attempt and, most importantly,
- proof of 3-wave, labored, corrective behavior on a subsequent recovery attempt.
When the market peaked on 21Sep18 before 4Q18’s 21% correction, the ensuing week’s erosion was nondescript and boring, lacking anything close to the media hyperbole that surrounds this week’s break. This initial erosion was followed by an almost 100% retracement/retest of 21Sep18’s 2947 high before rolling over again and taking out 26-Sep’s 2907 initial counter-trend low that confirmed that rebound as a correction. And even then, the market didn’t provide its obvious bull-breaking and obvious plunge until 10-Oct, 13 trading days from the high. IF IF IF yesterday’s high ended the bull and started a big, bad reversal lower, we believe it is highly, highly likely that there will be a bearish-hyperbole-reversing retest of the BEFORE any more serious move south unfolds. And needless to say, we will keep a keen eye on such prospective developments and update customers accordingly.