Posted on Jul 06, 2023, 08:24 by Dave Toth
By trickling above 16-Jun’s 4494 high last Fri, the market confirmed our suspicions in 26-Jun’s Technical Blog that that mid-to-late-Jun setback attempt was a corrective/consolidative affair within the still-developing bull trend. This resumed bull leaves 26-Jun’s 4368 low in its wake as the latest smaller-degree but critical corrective low this market is now required to weaken below to confirm a bearish divergence in daily momentum, break the uptrend from at least 04-May’s 4062 low and expose at least a larger-degree correction lower and possibly a more protracted move south. In this regard, this 4368 level is considered our new short-term but key parameter from which the risk of a still-advised bullish policy and exposure can be objectively rebased and managed.
From an even shorter-term perspective however, the 240-min chart below also shows the market’s failure this week to sustain last Fri’s “breakout” above 16-Jun’s 4494 high confirms a bearish divergence in very, very short-term momentum. This momentum failure on an admittedly very short-term basis defines last Fri’s 4498 high as one of developing importance and a mini parameter from which very short-term traders can objectively base non-bullish decisions like long-covers in order to circumvent the depths unknown of a correction lower. Obviously, 4498 is THE level this market now must recoup to reinstate the broader bull.
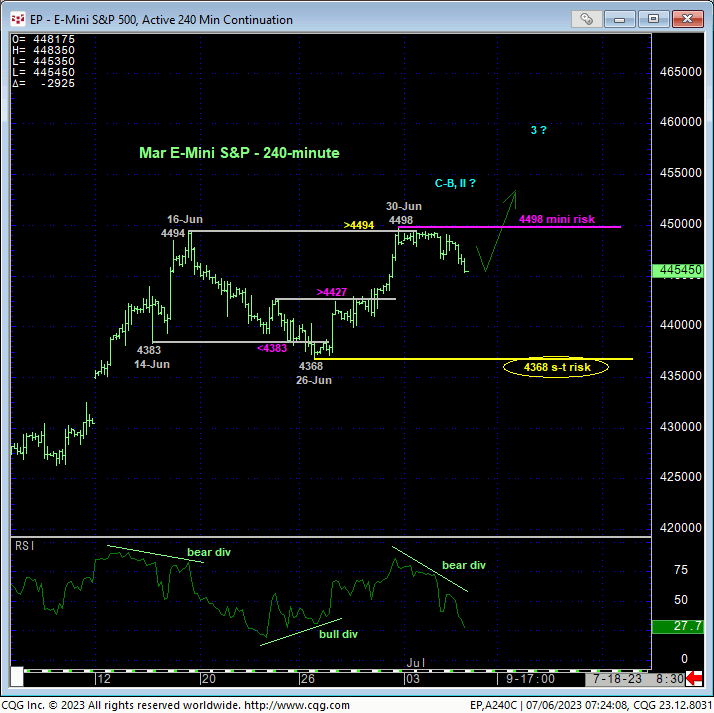
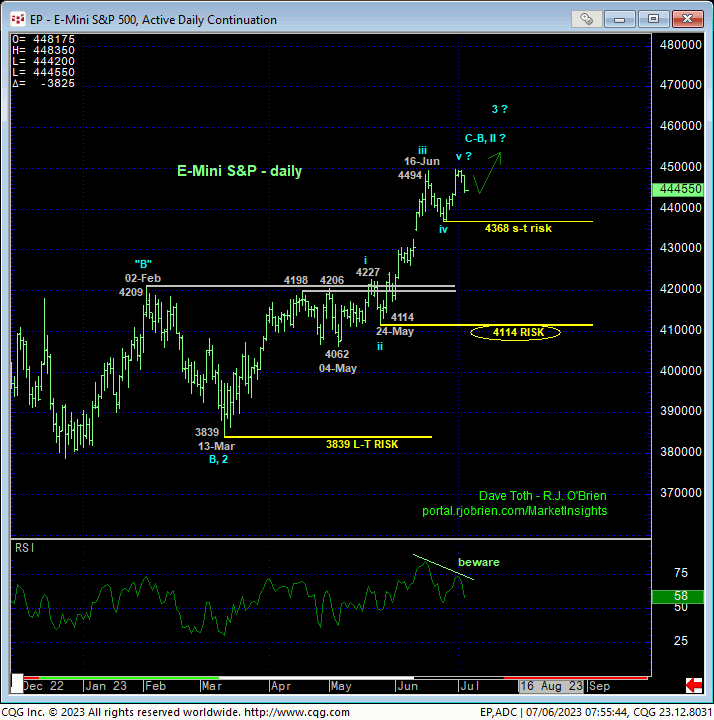
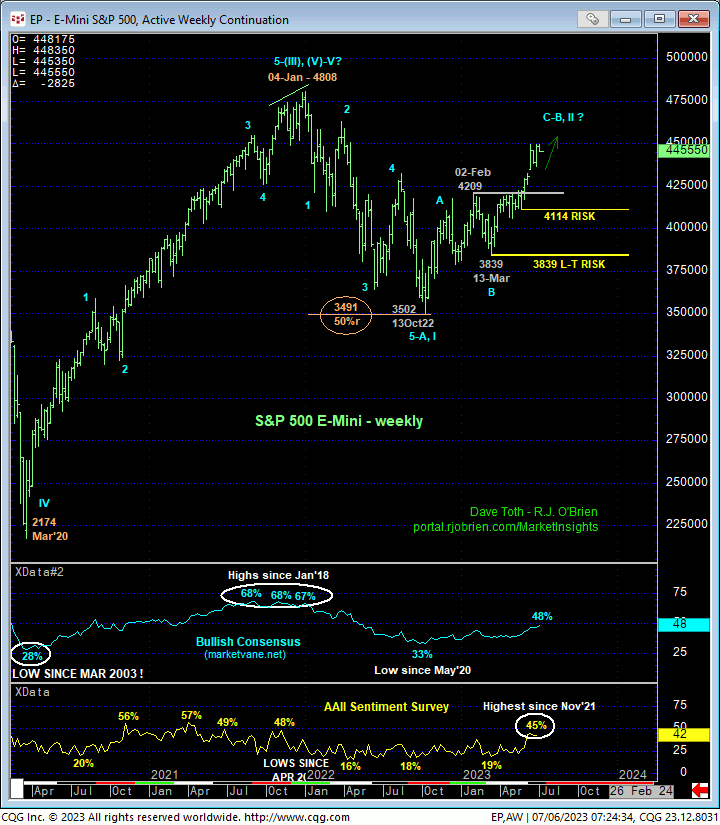
On a broader scale, the daily chart above shows the nicely developing potential for a bearish divergence in momentum. A failure below 26-Jun’s 4368 low will CONFIRM this divergence to the point of non-bullish action by shorter-term traders as this will, in fact, break the uptrend from at least 04-May’s 4062 low that may be a complete 5-wave Elliott sequence as labeled above. Once below 4368, there are few levels of any technical merit shy of key former resistance-turned-support for most of this year around the 4200-area.
Another factor that places emphasis on last week’s 4368 corrective low and bull risk parameter in the S&P is the continued move higher in interest rates. Short-term rates have already resumed their secular move higher (lower in the futures contract). Please see 29-Jun’s Technical Blog on the Jun24 SOFR contract that has resumed its secular bear trend.
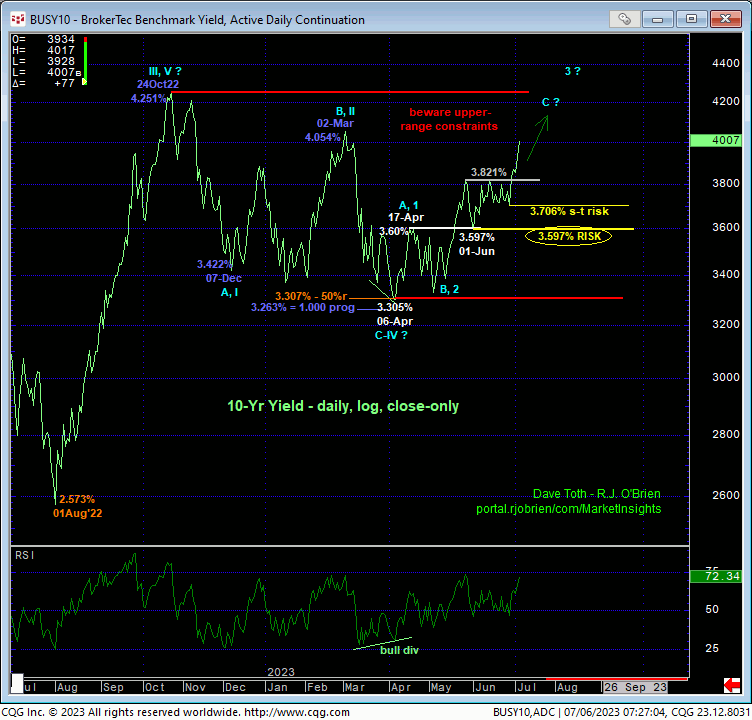
With regards to longer-term Treasury rates, the daily log close-only chart of 10-yr Treasury yields below shows the past week’s clear continuation of the reversal higher in rates following mid-Apr’s bullish divergence in momentum that leaves 06-Ar’s 3.305% low as the end of what looks to be a textbook 3-wave and thus corrective structure down from last Oct’s 4.25% high. Left unaltered by weakness below at least recent smaller-degree corrective lows and risk parameters at 3.706% and 3.597%, Oct-Apr’s sell-off attempt in 10-yr rates is considered a correction that warns of an eventual resumption of the secular move higher in rates to eventual new highs above last year’s 4.25% high. With tomorrow’s critical Jun nonfarm payroll and unemployment rate report coming out tomorrow, we don’t have to look far for prospective fuel for further rate hikes that, at some point, may pose a threat to equity valuations. Herein lies the importance of last week’s admittedly short-term corrective low and risk parameter at 4368 in the E-Mini S&P contract.
To be sure, on a very long-term scale, a failure below 4368 will NOT be of a sufficient scale to conclude a major reversal lower in the S&P. Indeed, commensurately larger-degree weakness below at least 24-May’s 4114 larger-degree corrective low and key long-term bull risk parameter remains required to break the uptrend from Mar’s 3839 major corrective low and expose the entire recovery attempt from last Oct’s 3502 low as a 3-wave and thus corrective affair that could then expose dire downside consequences. But what the market might have in store between 4368 and 4114 is anyone’s guess. And this brings the key technical and trading matter of SCALE into the equation. For longer-term institutional players and investors, a failure below 4368 is of too small a scale to pare of jettison bullish exposure. Per such, longer-term players acknowledge and accept bull risk to 4114. For those of a personal risk profile where risking bullish exposure to 4114 is too great, last week’s 4368 smaller-degree corrective low provides the only objective bull risk alternative.
The weekly chart below shows the magnitude of the 9-month recovery from last Oct’s 3502 low. As the market remains well below Jan’22’s 4808 high, it would be premature to conclude the current rally as the resumption of the secular bull trend to eventual new highs above 4808. but until and unless this market fails below at least 4114, the longer-term trend remains up and should not surprise by its continuance or acceleration. And per such a longer-term bullish count, it is imperative that this market continued to exhibit trendy, impulsive behavior to the upside like it did in 2020 and 2021. In this bullish count, the market wouldn’t be expected to come anywhere near 24-May’s 4114 corrective low, let alone break it.
These issues considered, a bullish policy and exposure remain advised with a failure below 4114 required for shorter-term traders to move to the sidelines and for even longer-term players to consider paring bullish exposure to more conservative levels in order to circumvent the depths unknown of at least an intermediate-term correction lower. Very, very short-term players also have the option of moving to a neutral-to-cautiously-bearish stance until/unless negated by a recovery above last Fri’s 4498 high needed to reaffirm the bull.