Posted on May 31, 2023, 03:05 by Dave Toth
As a result of yesterday’s break above 19-may’s 4228 high that establishes a new high for the entire recovery from last Oct’s 3502 low, the 240-min chart below shows that the market has identified 24-May’s 4114 low as the latest smaller-degree corrective low the market is required to sustain gains above to maintain a more immediate bullish count. It’s failure to do so won’t be of a sufficient scale to conclude anything more than another iterative corrective dip within the broader recovery, but it would be sufficient to questions the risk/reward merits of a bullish policy by shorter-term traders to neutralize exposure. Per such, we’re defining 4114 as our new short-term bull risk parameter.
This 240-min chart also shows the significant resistance over the past month-and-a-half ranging from 4228-to-4173 that we’d expect the market to acknowledge as new support per any broader bullish count. While last week’s 4114 low is a very minor corrective low, a failure below that threshold would also be the market’s failure to sustain gains above resistant levels that date from early-FEB. Given excruciatingly labored upside momentum over the past two months, if not since last Dec, even such admittedly minor weakness below a level like 4114 could not be overlooked as the start of a more protracted move south. UNTIL such sub-4114 weakness is proven however, this week’s dip cannot be ignored as another favorable risk/reward buying opportunity ahead of the resumption of the 7-1/2-month recovery.
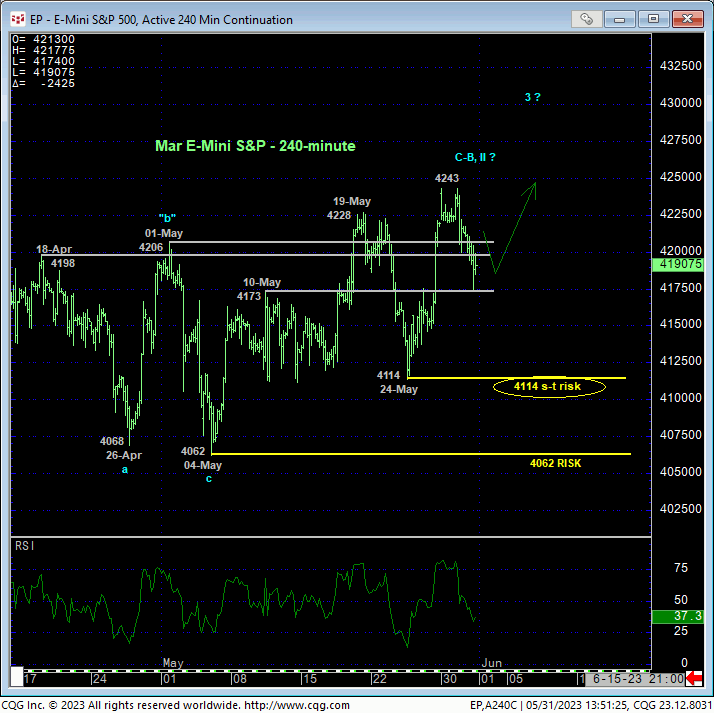
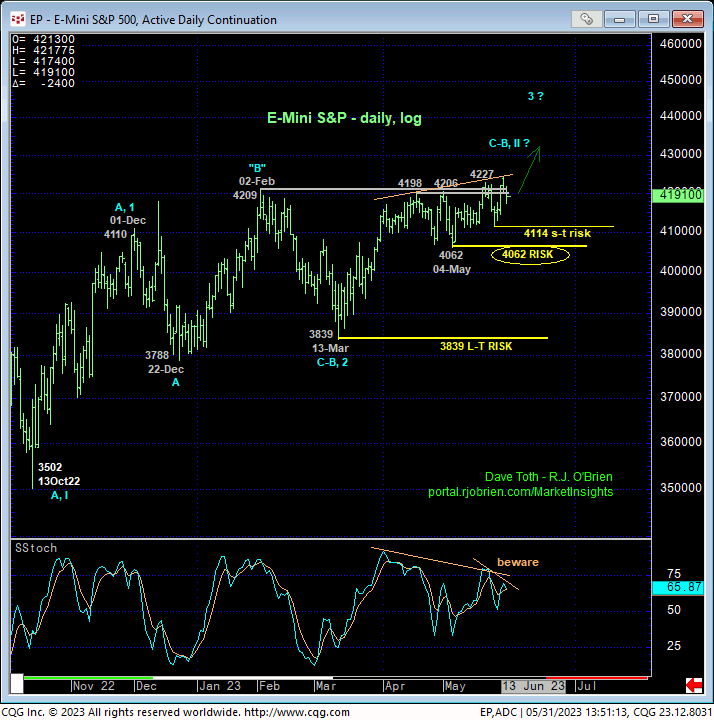
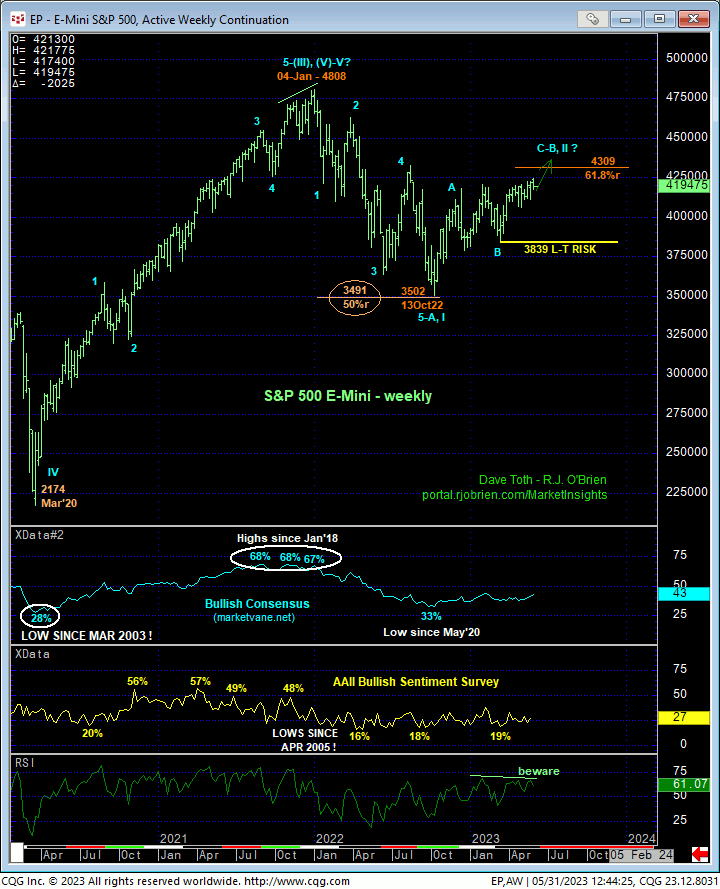
On a broader scale, both the daily (above) and weekly (below) log scale charts show very, very labored upside momentum. While the uptrend is clearly laboring and ascending at a slower rate, it remains an uptrend nonetheless and should not surprise by its continuance. To break the larger-degree uptrend from 13-Mar’s 3839 low, the market needs to confirm commensurately larger-degree weakness below 04-May’s 4062 corrective low. A short-term failure below 4114 could expose such a longer-term failure below 4062. These levels, along with 13-Mar’s major 3839 corrective low, serve as our short-, intermediate- and long-term parameters from which the risk of a continued bullish policy and exposure can be objectively based and managed.
If we seem infatuated with these recent corrective lows and bull risk parameters, it is squarely because of the prospect that the not unimpressive recovery from last Oct’s 3502 low, having yet to retrace 61.8% of 2022’s downtrend, still falls well within the bounds of a (B- or 2nd-Wave) CORRECTION within a major, multi-quarter peak/reversal process. And the extraordinarily labored manner in which this recovery has unfolded, at least thus far, is characteristic of exactly such a correction.
Such a long-term bearish count will only come to the forefront again however IF/when this market proves weakness below the specific corrective lows we identified above at 4114 (to begin with), 4062, and then certainly 3839. IF 2022’s plunge was just the start of a major bear market, the next leg down will not come as a surprise as we’ll have plenty of warning, first with short-term weakness below 4114 and ultimately with a failure below 3839 that could open the spigot. Until and unless such weakness is proven, and despite the labored nature of the uptrend, this uptrend should not surprise by its continuance or acceleration.
These issues considered, a bullish policy and exposure remain advised with a failure below 4114 required for short-term traders to step aside, further weakness below 4062 for institutional players to follow suit, and commensurately larger-degree weakness below 3839 for long-term investors to throw in the towel and prepare for a resumption of last year’s bear. In lieu of such weakness, further gains remain anticipated.