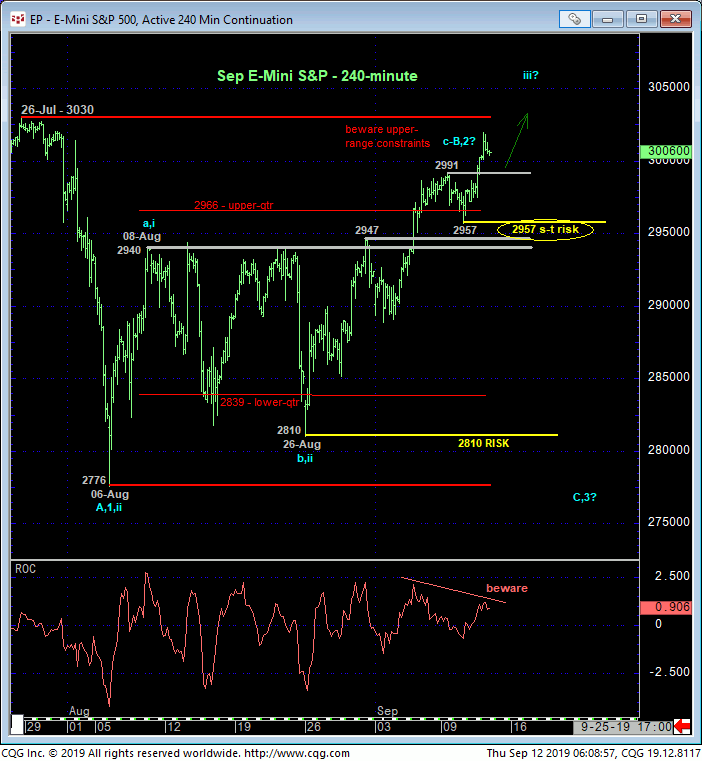
Yesterday’s break above Mon’s 2991 high reaffirms the developing uptrend and leaves Tue’s 2957 low in its wake as the latest smaller-degree corrective low the market is now minimally required to fail below to confirm a bearish divergence in short-term momentum, stem the past couple weeks’ uptrend and expose another intra-range relapse. Peer such this 2957 corrective low is considered our new short-term risk parameter from which shorter-term traders with tighter risk profiles can objectively rebase and manage the risk of a still-advised bullish policy.
This tight but objective risk parameter may come in handy given the market’s proximity to the extreme upper recesses of the past couple months’ range bounded on the top side by 26-Jul’s 3030 all-time high. If there’s a time and place for this market to fail, it is here and now and we will gauge such a failure around Tue’s 2957 low. Until and unless such sub-2957 weakness is proven however, and especially given historically LOW, pessimistic sentiment/contrary opinion levels DESPITE the market pressing all-time high, traders should not be surprised by a bust-out to resume the secular bull trend that’s only spittin’ distance away.


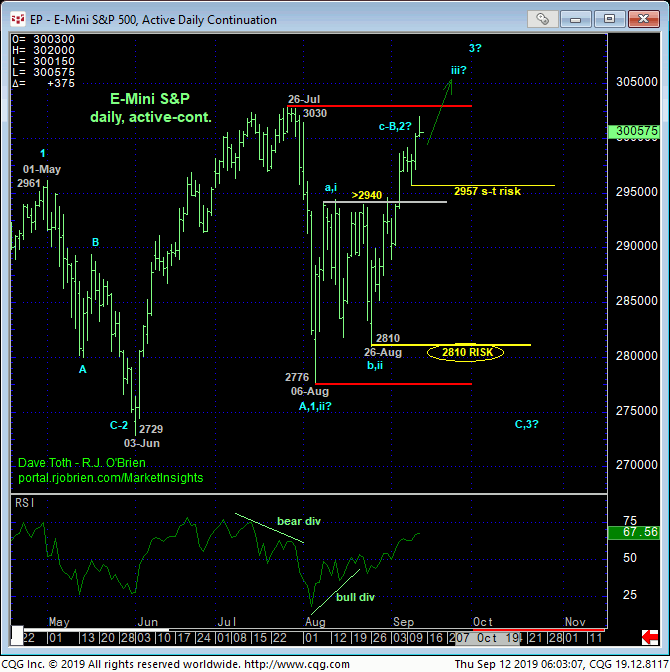
The daily chart above shows the market’s current position at the extreme upper recesses of the past couple months’ range. Indeed, it’s hard to ignore this situation as a potentially very slippery slope for bulls. Fortunately, the market has been very accommodative in identifying Tue’s 2957 corrective low as a tight but objective parameter around which to manage the risk of bullish exposure.
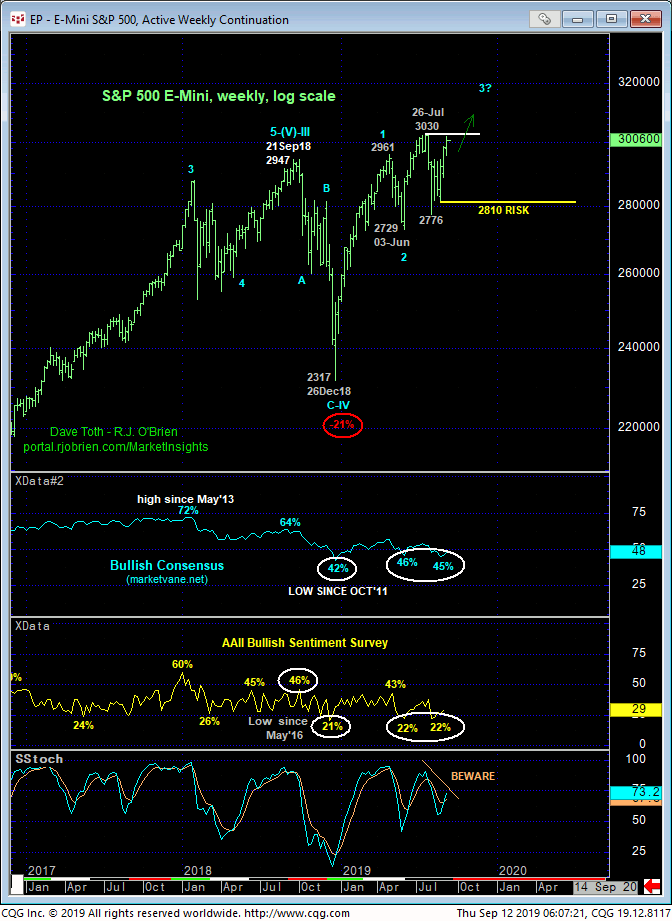
The unique and opportunistic factor is the fact that market sentiment/contrary opinion indicators are currently wafting around historic LOWS DESPITE the market pressing all-time highs. Only a glance at the Bullish Consensus (marketvane.net) and American Association of Individual Investors sentiment survey is needed to see that recent levels are typical of the ENDS of major corrections, not when the market is only a hiccup away from another round of all-time highs. This means that the huddled masses are not prepared or positioned for a resumption of the secular bull that could leave the market VULNERABLE to sharp, extended gains as the overall market forces them to chase the bull at what could be much higher levels.

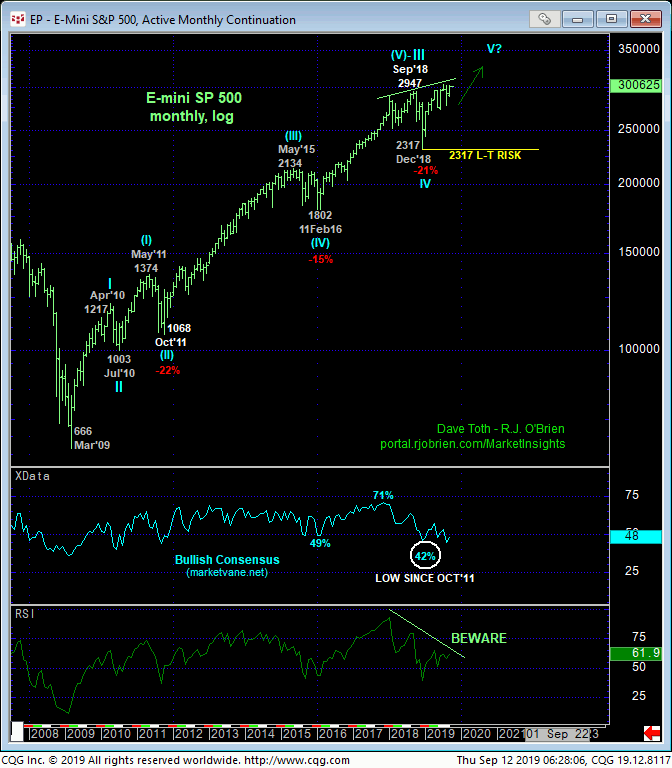
Finally, the monthly log scale chart below shows the secular bull market well intact. It’s easy to see and say that upside momentum has been waning for quarters, but this means absolutely nothing until and unless this market starts failing below prior corrective lows needed to CONFIRM a momentum failure needed to, in fact, break the very simple uptrends pattern of higher highs and higher lows. On a broader scale weakness below AT LEAST 26-Aug’s 2810 larger-degree corrective low remains required to even defer, let alone threaten the secular uptrend. Until and unless such commensurately larger-degree weakness is shown, further and possibly sharp, accelerated gains should not surprise.
Indeed, this long-term chart shows the latest portion of the bull from Dec’18’s 2317 low coming off a 21% correction. The previous 15% and 22% corrections in 2015/16 and 2011 were followed by EXTRAORDINARY GAINS. Especially with the huddled masses worried about China and tariffs and Iran and an inverted yield curve and the Fed and whatever else they’re worried about, traders are warned to be watchful for not only continued gains, but potentially very sharp gains.
If this bullish count is wrong and all of the reasons to be doubtful are right, all the market has to do is, initially, fail below 2957, then sustain trendy, impulsive behavior down and ultimately break below 2810. Until and unless such conditions are met, a bullish policy and exposure remain advised ahead of further and possibly accelerated gains to new all-time highs.


