Posted on May 01, 2023, 08:05 by Dave Toth
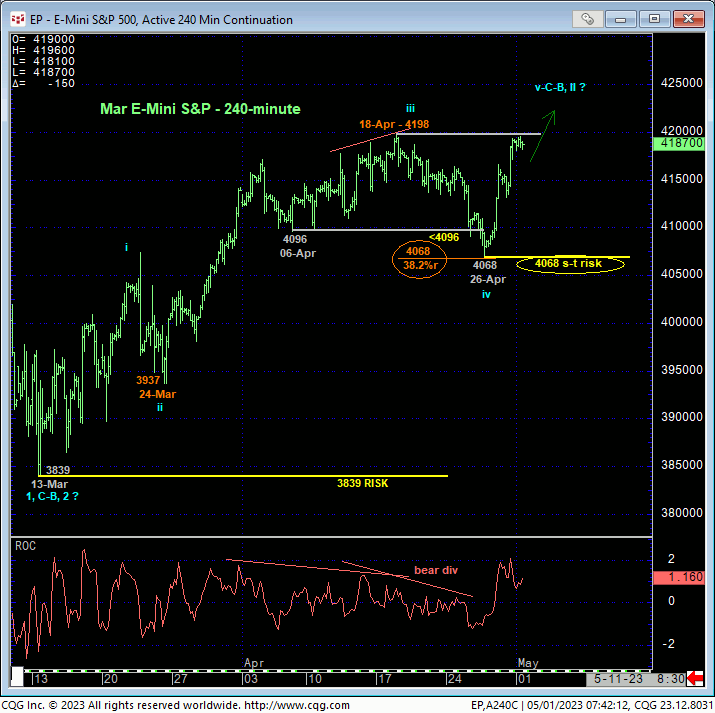
While last week’s slip below 06-Apr’s 4096 corrective low and our short-term risk parameter discussed in 19-Apr’s Technical Blog confirmed a bearish divergence in short-term momentum, the fact that the resulting setback attempt stalled at the exact (4068) 38.2% retrace of a suspected 3rd-Wave rally from 24-Mar’s 3937 low to 18-Apr’s 4198 high warned that that setback was just another (suspected 4th-Wave) correction within the broader recovery from last Oct’s 3502 low. Thur/Fri’s subsequent recovery reinforces this count and warns of a resumption of the broader recovery above mid-Jul’s 4198 intra-day high.
The importance of the past couple days’ recovery is the market’s definition of last week’s 4068 low as the end of lower boundary of the latest smaller-degree correction that this market is now minimally required to fail below to break the uptrend from 13-Mar’s 3839 larger-degree corrective low and expose at least an intermediate-term correction lower and possibly a more significant reversal lower. In this regard, 4068 is considered our new short-term but key bull risk parameter from which shorter-term traders can objectively rebase and manage the risk of a continued or resumed bullish policy.
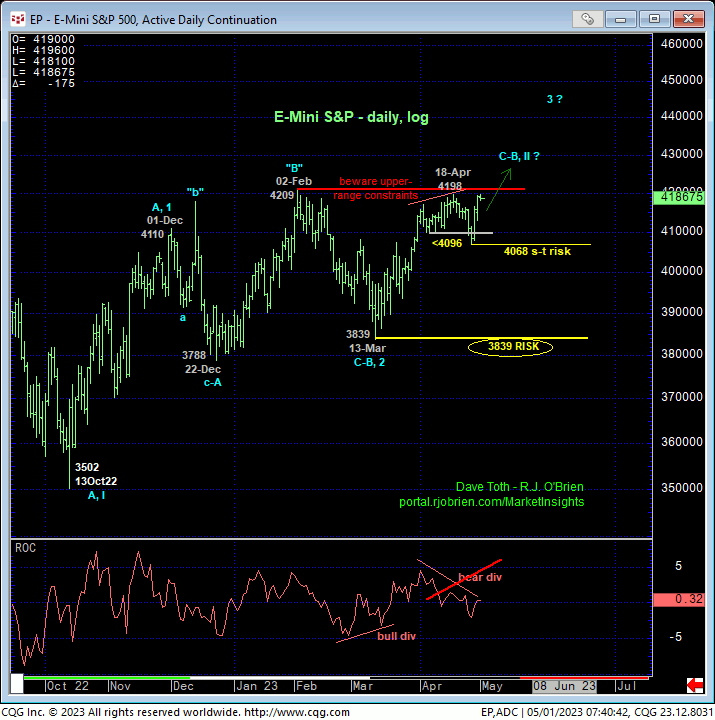
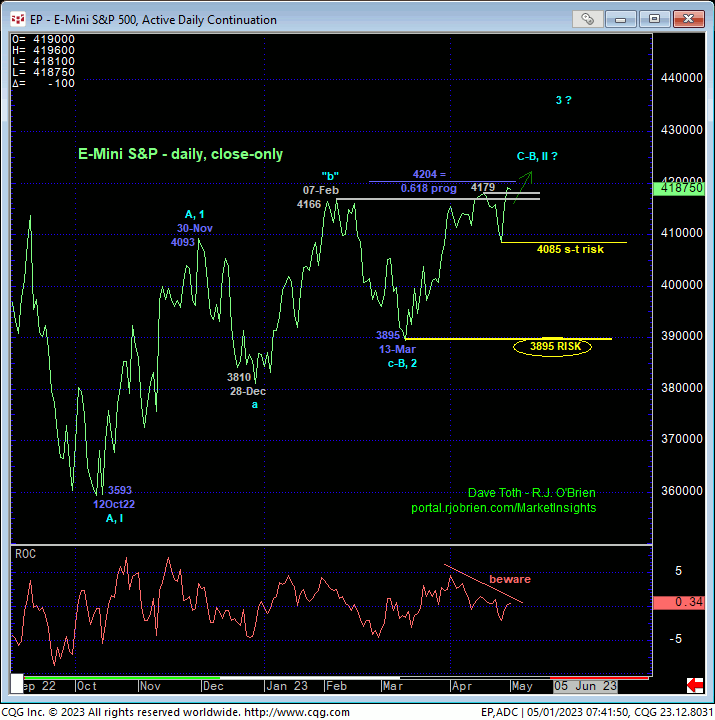
From a longer-term perspective, the daily log high-low chart above still shows the market constrained by resistance from 18-Apr’s 4198 high and 02-Feb’s 4209 high that would contribute to a broader peak/correction/reversal threat IF the market failed below 4068. On a daily close-only basis however, the chart below shows Fri’s close above both the mid-Apr and early-Feb highs to produce the highest close since 25Aug22, reaffirming the 6-1/2-month recovery attempt. On this closing basis, 26-Apr’s 4085 corrective low close is another short-term but key metric and risk parameter the market needs to stay above to maintain a bullish count.
By closing at a new high for the 6-1/2-month uptrend, the bull as every opportunity to PERFORM by sustaining trendy, impulsive behavior higher. Now-former 4166-to-4179-area resistance, since broken, would be expected to hold as new near-term support. Daily closes back below this area would be the first, albeit minor threat to the bull. A close below 4085 would be more significant and threaten the bull on the next larger-degree scale. An intra-day failure below 4068 would, in fact, break the uptrend from at least mid-Mar’s low and expose a more protracted correction or reversal lower. This said, 13-Mar’s 3839 intra-day low and/or that day’s 3895 corrective low close remains intact as our key long-term bull risk parameters pertinent to longer-term institutional players and investors. A failure below these thresholds, we believe, would re-expose 2022’s secular bear market.
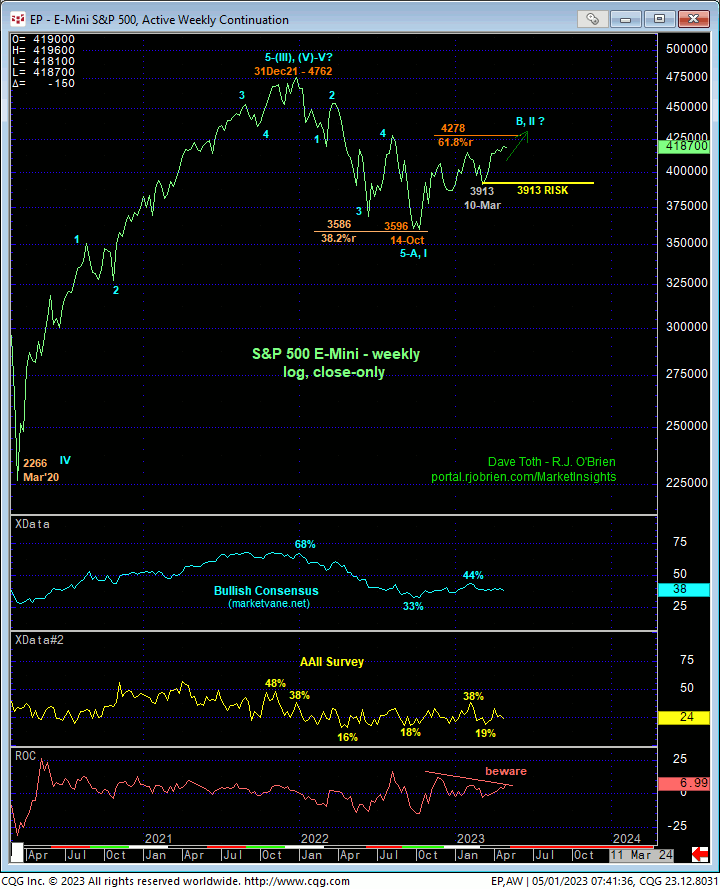
Finally, the weekly log close-only chart below shows the continued recovery from last Oct’s 3596 low weekly close. This chart also shows waning upside momentum that will be considered a confirmed bearish divergence if/when the market closes below mid-Mar’s 3913 larger-degree corrective low close. Until such commensurately larger-degree weakness is confirmed, the longer-term trend remains up. But given the magnitude of last year’s major slide, the 6-1/2-month labored recovery still falls well within the bounds of a mere (B- or 2nd-Wave) correction within a major, multi-quarter peak/reversal threat. And herein lies the crucial importance of mid-Mar’s corrective lows and longer-term bull risk parameters.
These issues considered, a bullish policy and exposure remain advised with a failure below 4068 required to defer or threaten this call enough for shorter-term traders to move to a neutral/sideline position and for even longer-term players to pare bullish exposure to more conservative levels. In lieu of such weakness, further and possibly accelerated gains are expected.