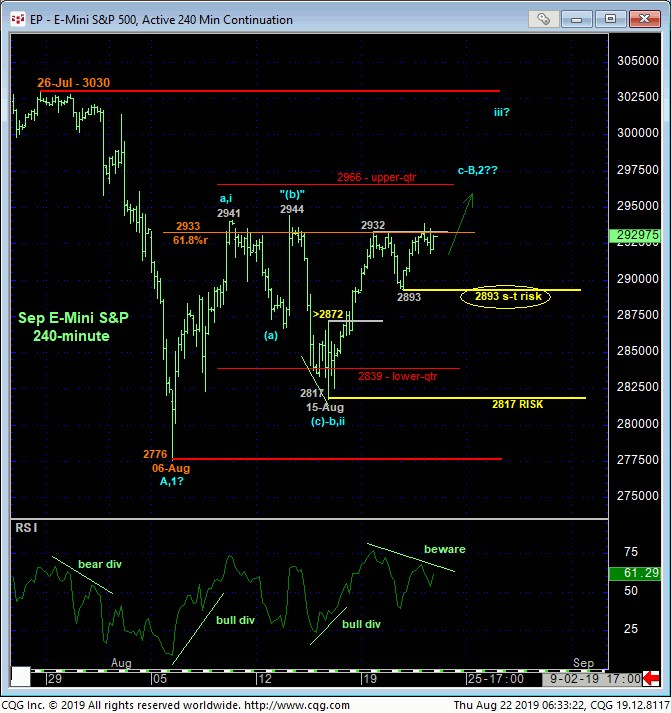
Overnight’s break above Mon’s 2932 high reaffirms the developing recovery from last week’s 2817 low and leaves yesterday’s 2893 low in its wake as the latest smaller-degree corrective low the market must now sustain gains above to maintain a more immediate bullish count. Its failure to do so will confirm a bearish divergence in momentum that will break at least the past week’s rally and might reinforce a peak/reversal-threat environment of a scale that no equity investor wants to think about. Peer such, traders are advised to trail protective sell-stops on longs from 2875 OB recommended in 16-Aug’s Trading Strategies Blog to a level just below 2893.
The 240-min chart below also shows this market engaging the general area around the (2933) 61.8% retrace of late-Jul/early-Aug’s 3030 – 2776 decline and resistant highs the past couple weeks ranging from 2932 to 2944. As we’ll discuss below, this area between these recent 2940-ish highs and 26-Jul’s 3030 all-time high is crucially important for anyone trying to navigate the correction-vs-reversal debate that began with that late-Jul relative meltdown from 3030 to 2776. And while a larger-degree momentum failure below 15-Aug’s 2817 next larger-degree corrective low and new key long-term risk parameter is required to confirm a more protracted correction or reversal lower, an admittedly smaller-degree momentum failure below our short-term risk parameter at 2893 would be a good initial indication of eventual longer-term weakness and vulnerability.
Conversely, IF the worst of a mere correction is behind us, then we would fully expect the bull to behave like one “up here” around the upper-quarter of the past month’s range by sustaining trendy, impulsive prices higher through 2950, 2975, 3000 and above.
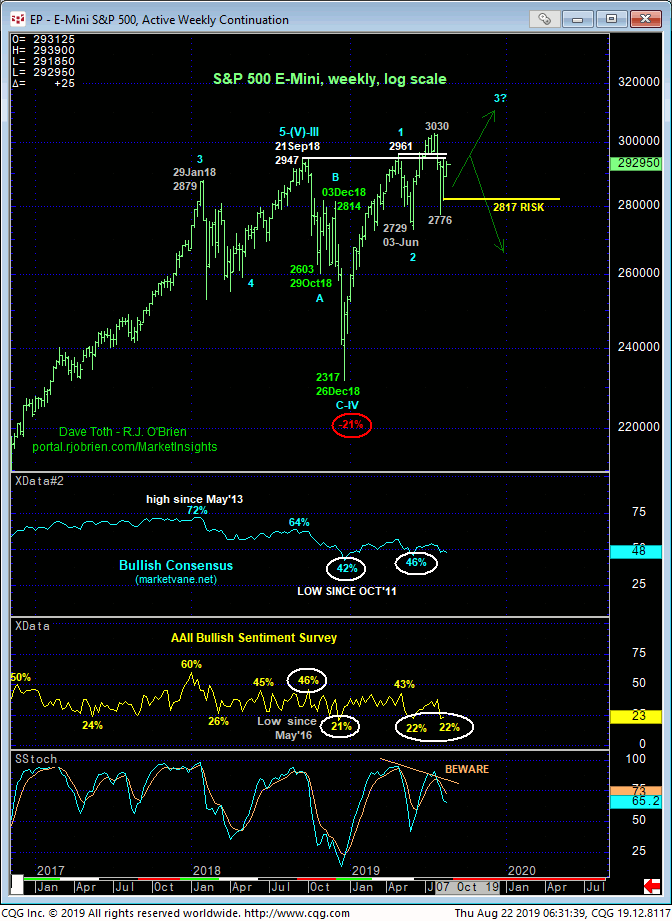
As a quick review, traders are reminded that, in peak/reversal processes, markets typically will have a corrective rebuttal to the initial counter-trend break. And when that initial counter-trend break is particularly obvious and hyperbole-filled, these (B- or 2nd-wave) corrective rebuttals/retests of the highs can be “more extensive”, often times retracing 61.8% or more of that initial (A or 1st-wave) decline.
This is exactly what happened late last year following Sep-Oct’18’s excitable, obvious, headline-filled decline from 21Sep18’s 2947 then-all-time high to 29’Oct’s 2603 low. Since the market rarely rewards emotional decisions so early in such a peak/reversal process, it followed up that initial, obvious sell-off with a 5-week, exact 61.8% retracement to 03-Dec’s 2814 high and area that, at the time, we labeled as a Rubber-Meets-the-Road Zone where the bull really needed to behave like one with trendy, impulsive upward behavior “up there”.
The market first confirmed a bearish divergence in short-term momentum below 2723 the morning of 04Dec18 that allowed us to conclude a major peak/reversal threat in 06Dec18’s Technical Blog. The market melted down 21% over the ensuing three weeks!
Looking back at the 240-min chart above, yesterday’s 2893 smaller-degree corrective low and 15-Aug’s 2817 larger-degree corrective low serve as our new short- and longer-term risk parameters below which a move away from bullish exposure and towards a bearish policy will be urged. Until and unless such weakness is proven, the bull has every opportunity to perform “up here” and carry on to new all-time highs given historically bearish sentiment/contrary opinion levels that are more typical of the ends of corrections rather than the starts of more protracted peak/reversal process.
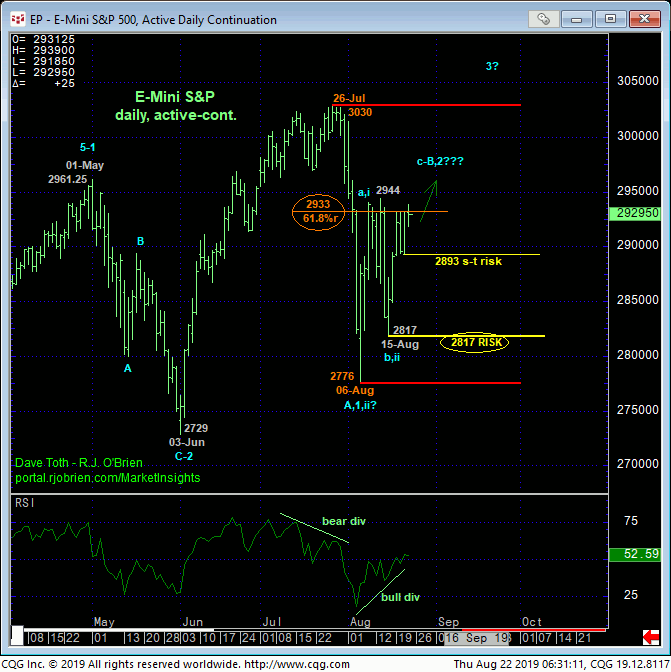
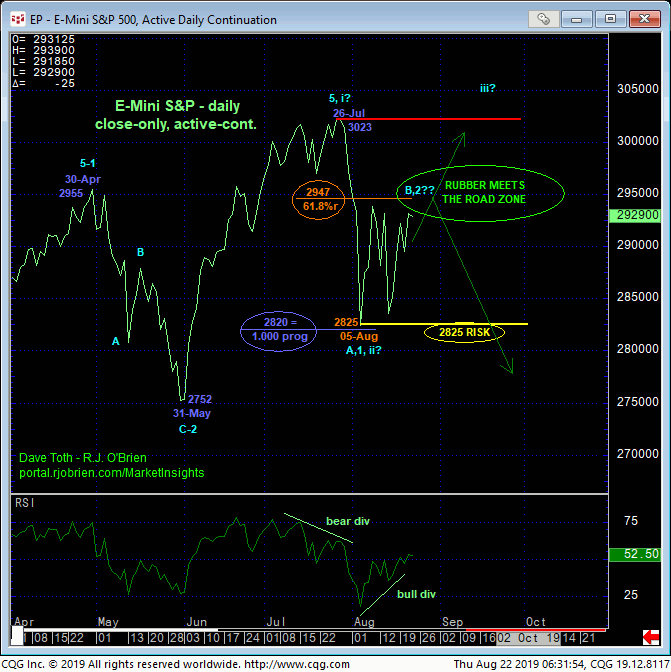
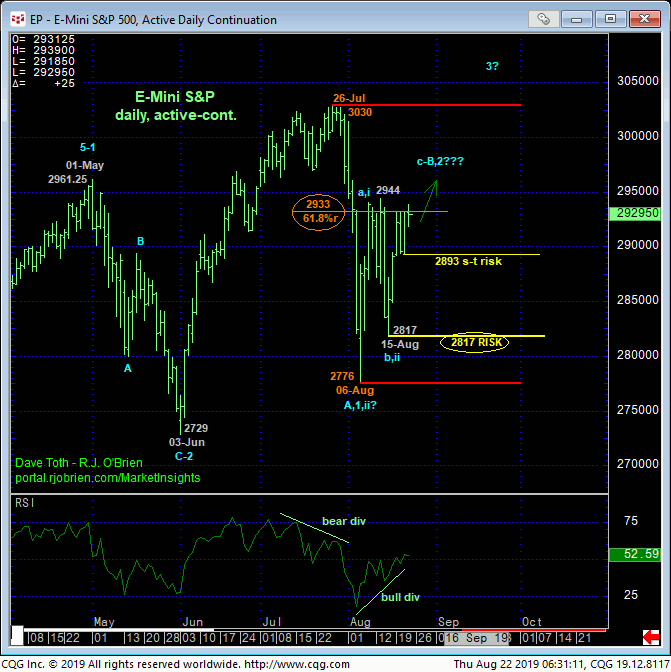
The daily bar chart above shows the market’s engagement of the area around the (2933) 61.8% retrace of Jul-Aug’s 3030 – 2776 spasm and upper-quarter of the past month’s range. This is a critical, pivotal condition that the bull needs to “perform” at to maintain a bullish bias and policy like it did in early-to-mid-Jun’s recovery and retest of 01-May’s 2961 high. And on a daily close-only basis below, it may prove important for a broader bullish count that Jul-Aug’s spasm from 3023 to 2825 was virtually identical in length (i.e. 1.000 progression) to Apr-May’s 2955 – 2752 decline. Along with historically bearish sentiment levels, it’s not hard to find BULLISH factors that could lead to a resumption of the secular bull straight away to new all-time highs. But again, if that’s what the market has in store, then it is from these current price levels and condition where the rubber-meets-the-road and the bull has to perform. And such continued trendy, impulsive, even accelerated prices to the upside should be increasingly obvious. A failure, first below 2893 and then below 2817 would not only NOT be consistent with such a bullish count, it would reinforce a peak/reversal process that could be major in scope.
These issues considered, a bullish policy and exposure remain advised with a failure below 2893 required for shorter-term traders to neutralize longs from 2875 OB and move to a neutral-to-cautiously-bearish stance. Long-term players are advised to pare bullish exposure to more conservative levels on a failure below 2893 and jettison all remaining exposure altogether on a failure below 2817 that would reinforce a peak/reversal threat that could be major in scope. In lieu of such weakness, further and possibly accelerated gains straight away remain expected.
