Posted on Aug 16, 2023, 07:43 by Dave Toth
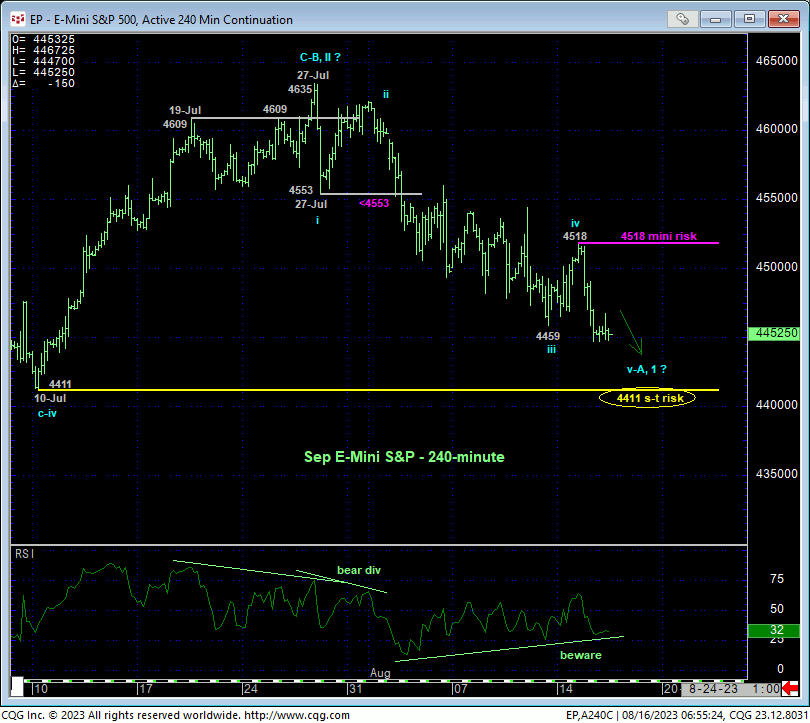
Yesterday’s continued weakness below Fri’s 4459 low perpetuates at least an interim bearish count discussed in 02-Aug’s Technical Blog and leaves yesterday’s 4518 high in its wake as the latest smaller-degree corrective high this market is now minimally required to recoup to confirm a bullish divergence in short-term momentum, arrest the slide and expose at least a corrective rebound. In this very short-term regard, yesterday’s 4518 high serves as our new mini parameter from which the risk of non-bullish decisions like long-covers and bearish punts can be objectively rebased and managed by very short-term traders with tighter risk profiles.
What intermediate-to-longer-term traders and investors may want to take note of however is the 5-wave impulsiveness of the decline from 27-Jul’s 4635 high. As corrections are not trendy 5-wave structures, theoretically this suggests that even if the market recoups yesterday’s 4518 high, such a rebound might only be an interim (B- or 2nd-Wave) correction of this month’s initial (A- or 1st-Wave) decline within a larger-degree correction or reversal lower. We will address this issue if/when the market recovers above 4518. In the meantime, the next pertinent technical issue is whether this slide continues and takes our 10-Jul’s larger-degree corrective low and short-term but key bull risk parameter at 4411.

In 02-Aug’s Technical Blog we noted that that day’s bearish divergence in very short-term momentum was of an insufficient SCALE to conclude anything more than an interim corrective setback against the broader uptrend from last Oct’s 3502 low. But we also noted that larger-degree momentum failures start with smaller-degree momentum divergences just like that from 02-Aug, with 10-Jul’s 4411 larger-degree corrective low being the next pertinent and larger-degree corrective low and litmus test the market needed to sustain gains above to maintain a more immediate bullish count. A failure below 4411 would arguably confirm a bearish divergence in WEEKLY momentum that, given the market’s recent proximity to and rejection thus far of the extreme upper recesses of the past year-and-a-half’s range, could result in a more protracted correction or reversal lower pertinent to longer-term institutional traders and investors.
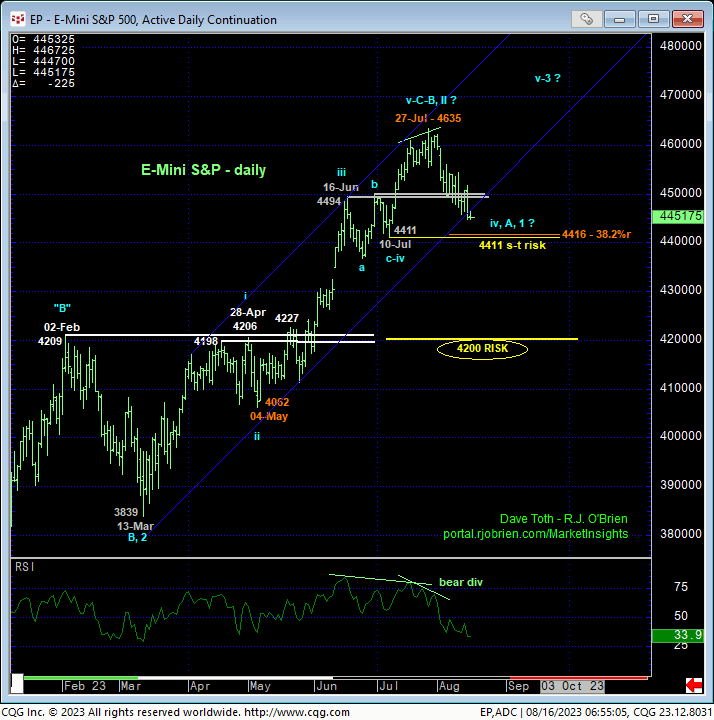
Only a glance at the daily chart below is needed to see that if this market fails below 10-Jul’s 4411 corrective low, the market will have, in fact, broken the uptrend from at least 04-May’s 4062 low. Combined with the possibility that 27-Jul’s 4635 high completed a 5-wave Elliott sequence from 13-Mar’s 3839 low as labeled below, a sub-4411 failure would have to be considered a “next level” threat against the broader bull.
As the market has yet to retrace even a Fibonacci minimum 38.2% (to 4416) of May-Jul’s rally from 4062 to 4635, this month’s relapse falls well within the bounds of a mere (4th-Wavce) correction of an eventual 5-wave sequence up from Mar’s 3839 low. But for such a bullish count to be resurrected, the market MUST arrest the current slide with a countering bullish divergence in short-term mo from, we believe, some area around 10-Jul’s 4411 low. Herein lies the importance of yesterday’s 4518 corrective high and mini bear risk parameter. Until and unless such strength is shown, and especially if the market breaks below 4411, longer-term players are advised to be making plans for paring or neutralizing bullish exposure.

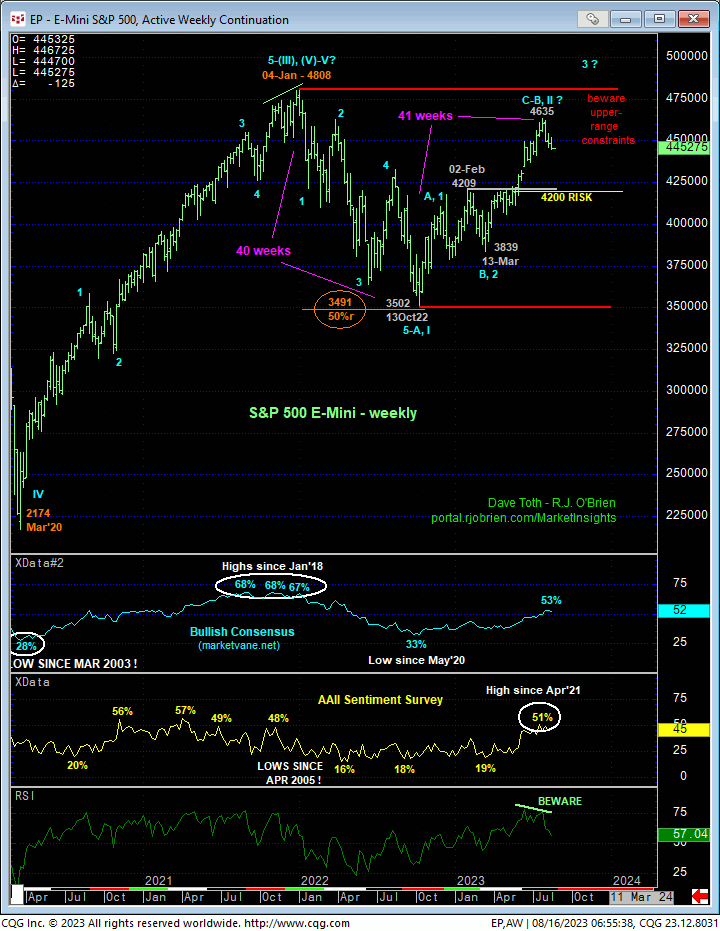
On a much longer-term basis, the weekly chart below shows:
- the market’s recent proximity to and rejection thus far of the extreme upper recesses of and resistance from the past 19-mont range amidst
- waning upside momentum
- the highest bullish sentiment/contrary opinion levels in at least a year and
- the recovery from last Oct’s 3502 low spanning an almost identical length of time (41 weeks) to Jan-Oct’22’s downtrend.
The upper extreme of a range presents a precarious situation due to the obvious resistance that questions the risk/reward metrics of a longer-term bullish policy due to the prospect of another intra-range relapse that could be significant in scope. Such intra-range vulnerability will be reinforced on proof of larger-degree weakness below 10-Jul’s 4411 corrective low and risk parameter as we see little in the way of any technical levels of merit between 4411 and key former resistance-turned-support around the 4200-area.
Again, against the backdrop of even the 5-month rally from 13-Mar’s 3839 low, let alone the 10-month rally from Oct’22’s 3502 low, even a momentum failure below 4411 would still leave the sell-off from 27-Jul’s 4635 high within the bound of a mere correction within the longer-term uptrend. But it would be incumbent on the bull to arrest the slide with a countering bullish divergence in momentum to maintain the odds of such a longer-term bullish count. In lieu of such a bullish divergence in mo, the extent of the market’s weakness below 4411 would be indeterminable and potentially severe.
On an even broader basis, pertinent to long-term investors who want to remain positioned for a resumption of the secular bull trend to new all-time highs above Jan’22’s 4808 high, the major line in the sand is the 4200-area. A failure below 4200 will jeopardize the impulsive integrity of a long-term bullish count up from last Oct’s 3502 low, render this recovery a 3-wave and thus corrective affair, and expose, we believe, at least a return to the lower recesses of the 19-month range OR a resumption of last year’s secular bear market to levels potentially well below 3502. Loong-term bulls who do not pare or neutralize bullish exposure on a failure below 4411 are acknowledging and accepting bull risk to 4200 as there are NO objective technical levels of merit between 4411 and 4200.
These issues considered, a bearish policy remains advised for shorter-term traders with a recovery above 4518 required to negate this call and warrant taking profit ahead of at least an interim corrective rebuttal to the decline from 4635. Longer-term institutional players and investors remain OK to maintain a bullish stance with a failure below 4411 deferring or threating a longer-term bullish count enough to warrant moving to a neutral/sideline position and circumventing the depths unknown of a larger-degree correction or reversal lower.


