Long time readers of our blog know of our disdain for merely “derived” levels that are rarely hard to find in much of the technical analysis that gets spewed each day. Such derived levels like Bollinger Bands, trend lines, imokus, the ever-useless moving averages and even the vaunted Fibonacci relationships we cite often in our own analysis never have proven to be reliable and safe reasons to buck a trend in the absence of a confirmed momentum divergence needed to, in fact, break that trend. And they never will. However, there is a pair of Fibonacci relationships that- along with some compelling ancillary evidence- that warrants attention.
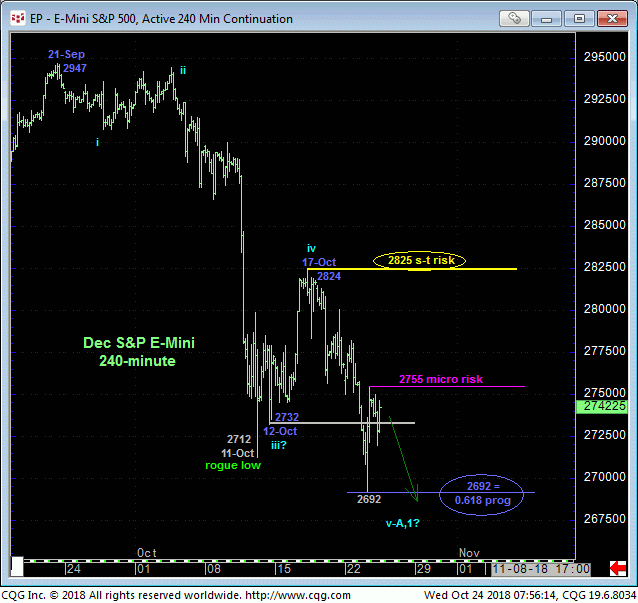
In just yesterday’s Technical Blog we identified a minor corrective high from Mon at 2782 as a micro risk parameter this market is required to recoup to jeopardize the impulsive integrity of the clear and present downtrend and expose a correction higher that could be extensive in scope. We are not advising traders to trail that micro risk parameter to yesterday’s 2755 high, the break above which would confirm at least the short-term tend as up. And stemming from the pair of Fibonacci relationships discussed below, such 2755+ strength could morph directly into that steeper rebound.

It’s been our opinion that given the extent and impulsiveness of the past month’s decline that this break from 21-Sep’s 2947 all-time high is just the initial (A- or 2st-Wave) decline of a broader peak/correction environment that could span months or even quarters. Within such a broader peak/correction PROCESS however is expected to be a potentially extensive (B- or 2nd-Wave) corrective rebuttal to the recent break. But while a bullish divergence in momentum above 17-Oct’s 2825 corrective high remains required to, in fact, break the recent downtrend, the (potentially complete) 5-wave appearance to the decline from 2947 to yesterday’s 2692 low is hard to ignore when:
- the prospective 5th-Wave down from 2824 spans a length exactly 0.618 that of the net distance of Waves-1-thru-3 (2947 to 12-Oct’s 2732 low) shown in the 240-min chart above and
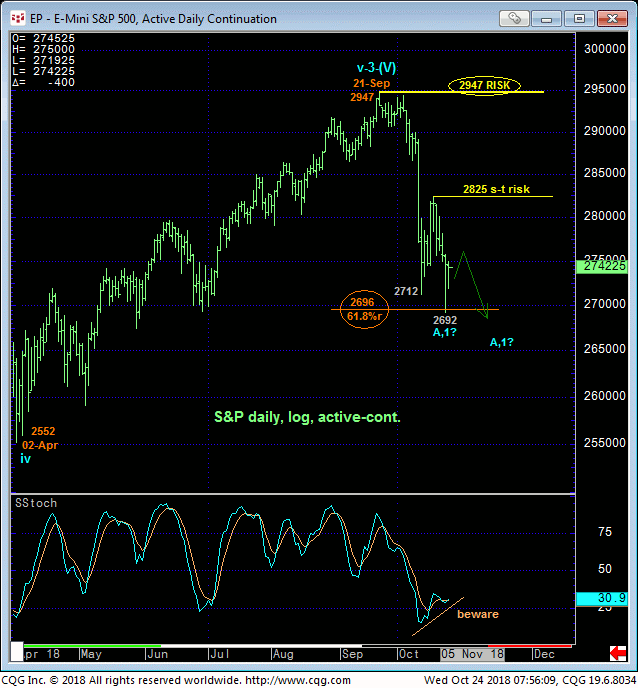
- when yesterday’s 2692 low is only four points from the (2696) 61.8% retrace of Apr-Sep’s rally from 2552 to 2947 as shown in the daily log chart below.
The developing POTENTIAL for a bullish divergence in momentum is also clear in the daily chart below, BUT a recovery above 2825 is required to CONFIRM this divergence to the point of non-bearish action.
HOWEVER….

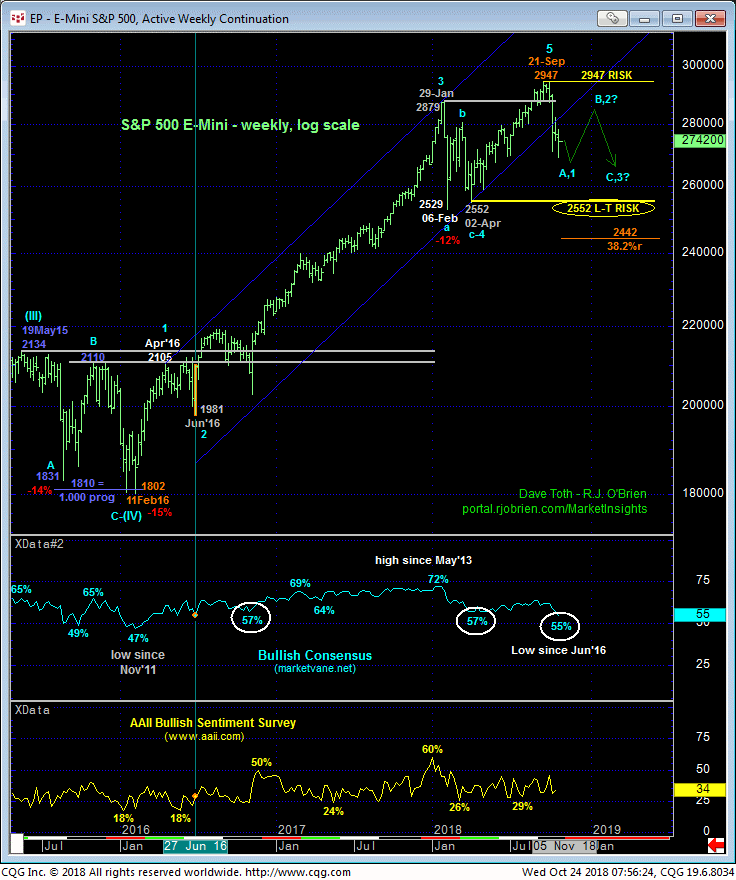
…The weekly log chart below shows that, understandably, market sentiment has collapsed to relatively historically low levels that have warned of and accompanied virtually every correction end within the secular bull market for years. Indeed, the current 55% reading in the Bullish Consensus (marketvane.net) is the lowest since Jun’16 and the end to a correction and start of the resumption of the secular bull.
Could the market shrug off all of this bottom-picking mumbo-jumbo and continue its meltdown? Absolutely. No question; until and unless it does “something” to threaten the clear and present downtrend. And while of an admittedly very short-term scale, we believe that “something” could be a recovery above yesterday’s 2755 high. Such a poke would at least identify yesterday’s 2692 low as one of developing importance and a specific risk parameter from which non-bearish decisions like short-covers and cautious bullish punts can be objectively based and managed.
These issues considered, a cautious bullish punt is advised on the immediate break above 2755 with a failure below 2692 required to negate this specific call, reinstate the bear and expose potentially sharp losses thereafter.


