Posted on Dec 16, 2022, 07:54 by Dave Toth
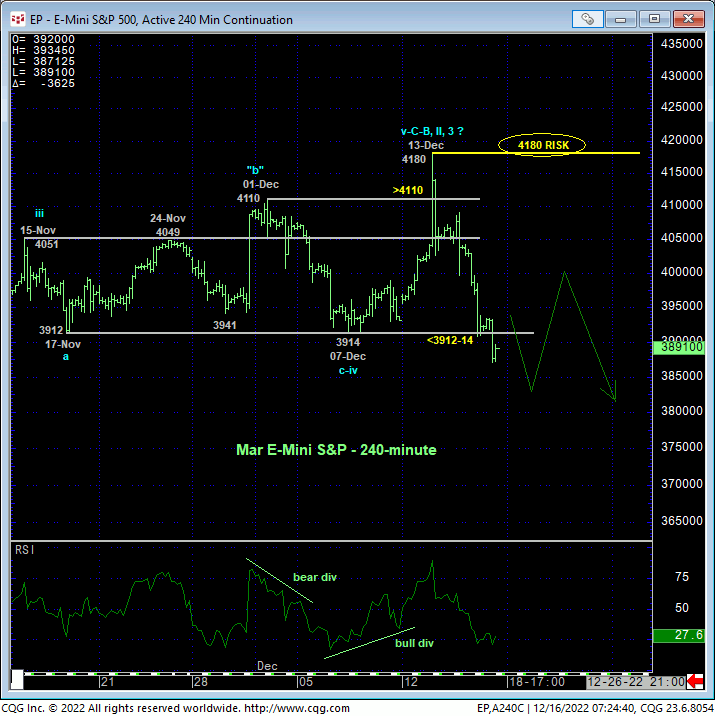
Over the past few weeks and especially following this past Tue’s spike to yet another new high for the 2-month recovery, we have focused on the 3912-to-3914-area as a key low, support and risk parameter the market needed to sustain gains above in order to maintain at least the intermediate-term uptrend from 13-Oct’s 3502 low. The market’s failure yesterday below this area, as well as the impulsiveness with which this week’s relapse has unfolded, not only breaks the 2-month uptrend, but also exposes at least a larger-degree correction lower and possibly the resumption of this year’s major bear market. As a direct result of this bearish divergence in momentum, the market has identified Tue’s 4180 high as one of obvious importance and, we believe, this market’s single most important technical level heading forward. Until and unless this market recoups this week’s 4180 high, traders are advised to approach this market’s downside potential as indeterminable and potentially extreme.


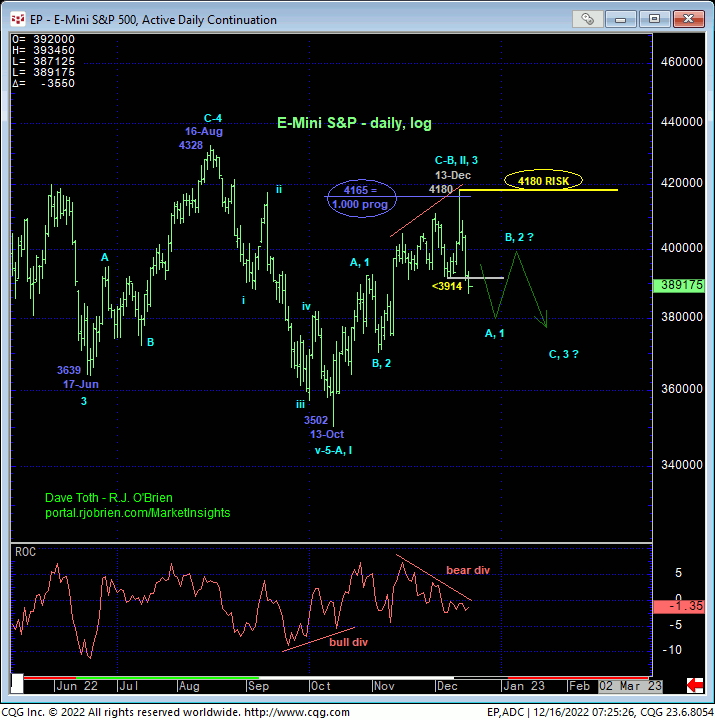
The daily log scale chart above shows yesterday and overnight’s break below 3914 that confirms a bearish divergence in momentum and, in fact, breaks the 2-month uptrend from 13-Oct’s 3502 low. It may also prove important to note from a long-term bearish perspective that the rally from that 3502 low was virtually identical in length (i.e. 1.000 progression) and time (42 trading days vs 40 trading days) to Jun-Aug’s 3639 – 4328 rally that proved to be just a correction in this year’s major bear market.
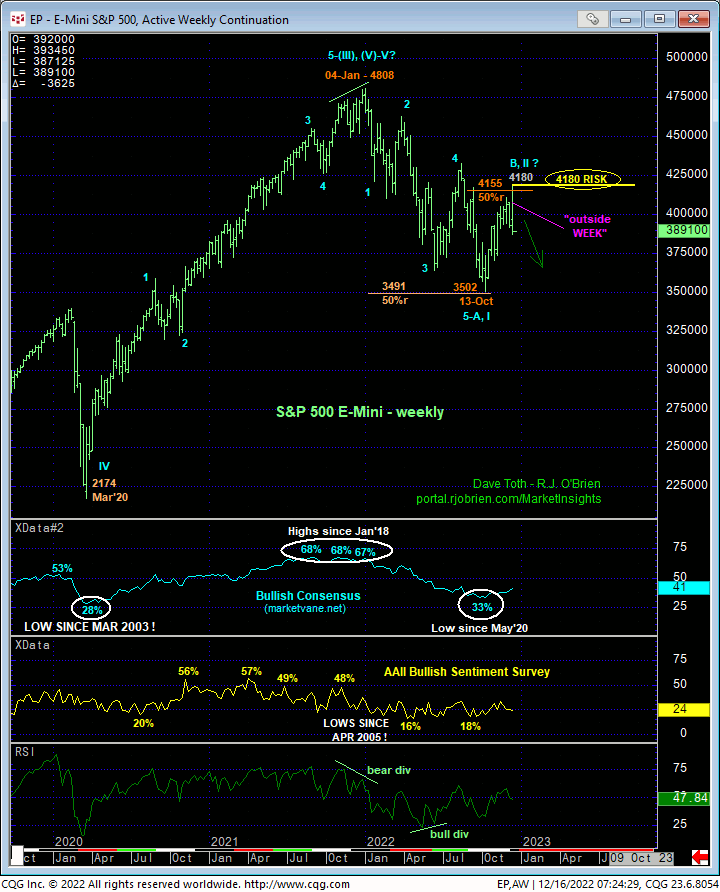
Additionally, the weekly chart below shows this market working on an “outside WEEK down” this week (higher high, lower low and lower close than last week’s range and close) after coming within 25-pts of the (4155) 50% retrace of Jan-Oct’s entire 4808 – 3502 decline). These facts reinforce this week’s 4180 high as one of developing and potentially long-term importance as a risk parameter from which non-bullish decisions like long-covers and new bearish punts can be objectively based and managed.
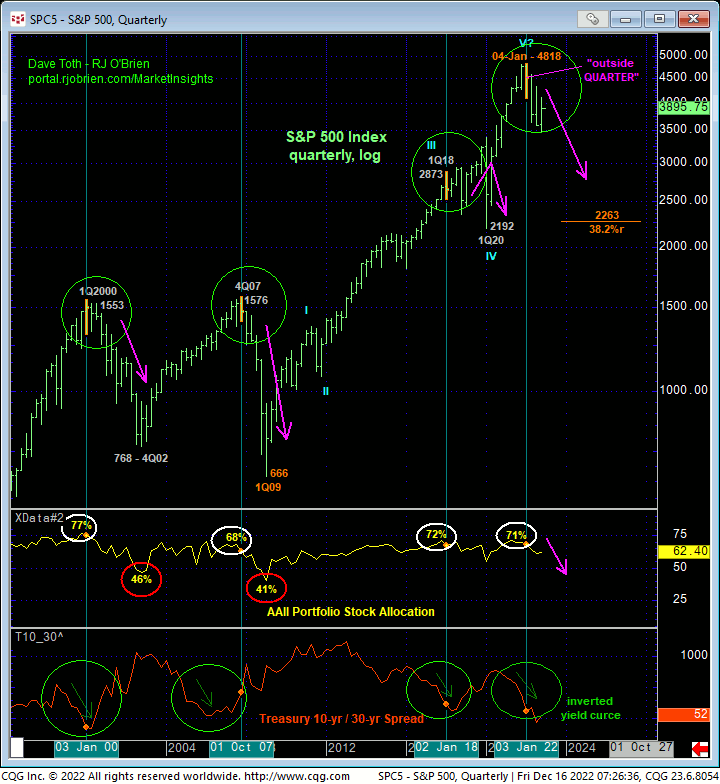
This weekly chart also shows Oct-Dec’s recovery stemming from pretty much the exact (3491) 50% retrace of 2020 – 2022’s massive bull trend. Might 13-Oct’s 3502 low be the end or lower boundary of a massive BULL market correction? Yes. Or might 13-Oct’s 3502 low be just the A- or 1st-Wave of a new secular bear market? Yes. Everything hinges on the MANNER in which this market’s peels lower in the period ahead following overnight’s bearish divergence in momentum, with this week’s 4180 the absolutely pivotal level this market now has to recoup to mitigate a long-term bearish count and reinforce a longer-term bullish count.
IF a broader bullish count is what the market has in mind, it is absolutely imperative at this juncture for 1) this market to unfold in a more labored, corrective MANNER as it tries to sell off and 2) HOLD ABOVE 13-Oct’s 3502 low. IF the market is poised to resume this year’s major bear market, then it would be expected to trade lower in a trendy, impulsive manner and SUSTAIN LOSSES BELOW 4180. The death knell to bulls would be an ultimate break below 3502.
While we cannot conclude either count at this juncture, what we CAN conclude is Tue’s 4180 high as on objective level from which to base non-bullish decisions like long-overs and cautious bearish punts. Per such, traders have been advised to neutralize any/all bullish exposure as a result of overnight’s failure below 3914-12 with a recovery above 4180 negating this call and warranting a return to a bullish stance. Against this developing peak/correction/reversal-lower backdrop, short-term recovery attempts may also be approached as cautious corrective selling opportunities with a recovery above 4180 negating this call and warranting its cover. In lieu of such 4180+ strength, further and possibly steep losses should not surprise.


