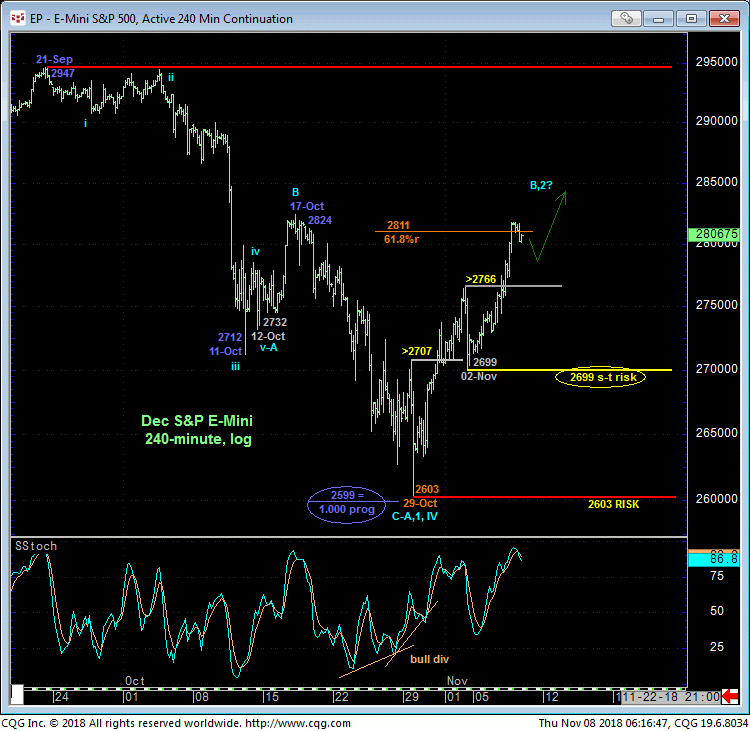
Since the mini-meltdown days of late-Oct when the market was nearing its eventual 2603 low, we discussed the likelihood of a potentially extensive rebound EVEN WITHIN the prospect of a more significant PEAK/correction/reversal process. Beginning with Halloween’s bullish divergence in short-term momentum above 2707 updated in that morning’s Technical Blog, the 240-min chart below shows that the market has provided exactly such a rebound. Yesterday’s resumed rebound above last Fri’s 2766 high leaves last Fri’s 2699 low in its wake as a smaller-degree corrective low and shorter-term risk parameter from which a resumed cautious bullish policy and exposure can be objectively rebased and managed. And despite its “smaller-degree” status, we believe this 2699 level is a critical flexion point that bulls of any duration or scale do NOT want to see this market slip below.

We had a number of technical facts on which the late-Oct/early-Nov base/recovery was predicated, including:
- Halloween’s bullish divergence in momentum
- the Fibonacci fact that the (prospective C-Wave) decline from 17-Oct’s 2824 high was virtually identical in length (i.e. 1.000 progression) to 21-Sep-to-11-Oct’s preceding 2947 – 2712 decline
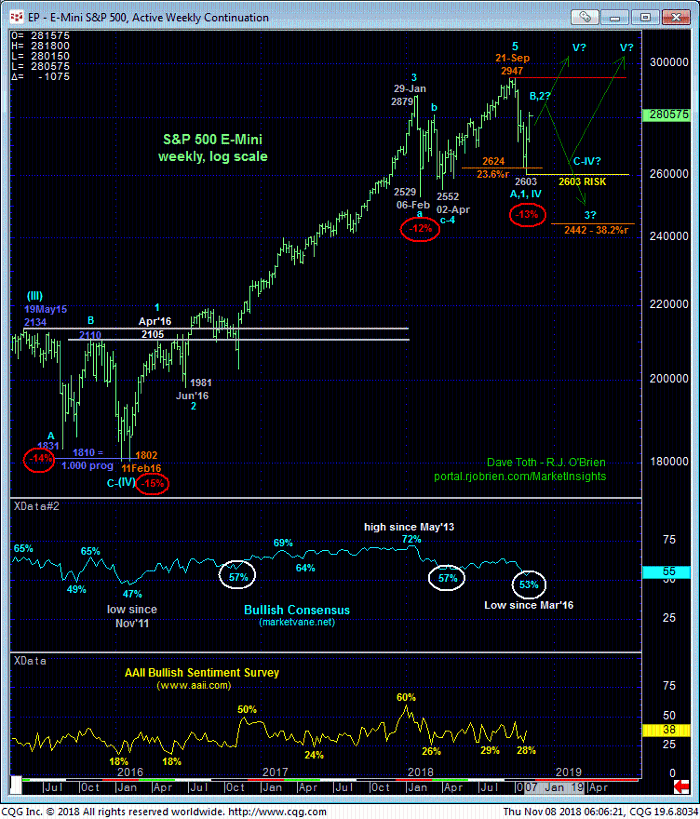
- the 13% decline that was virtually identical to each of the three deepest corrections (12%, 15%, 12%) over the past 6-1/2 years and
- the not unexpected erosion to 2-1/2-yr low of 53% in the Bullish Consensus measure of contrary opinion/sentiment.
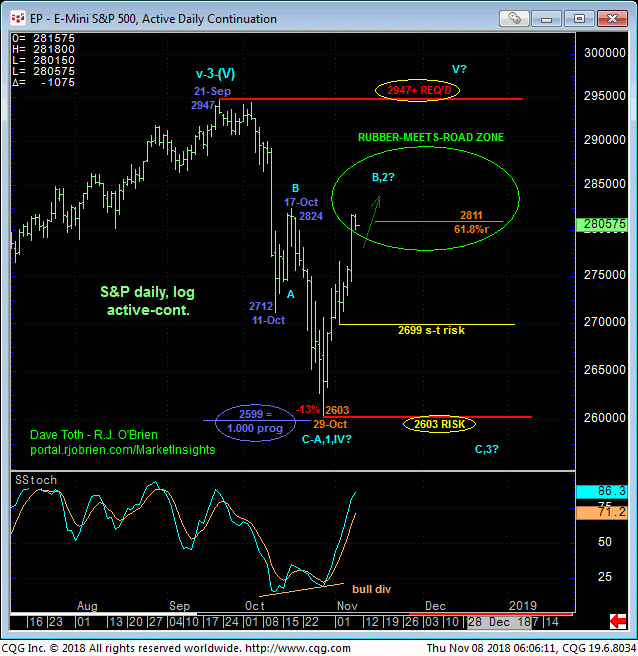
The prospect that Sep-Oct’s 5-week plunge sub-divided into only 3-waves as labeled in the daily log chart below is also noteworthy. Left unaltered by a relapse below 29-Oct’s 2603 low, that low arguably defines the end or lower boundary of a corrective/consolidative structure consistent with the secular bull trend to eventual new highs above 2947. The technical and trading challenge now is whether the current rebound is part of the resumption of the secular bull above 2947 OR merely a (B- or 2nd-Wave) corrective rebuttal within a larger-degree correction or reversal laterally-to-lower.
IF the latter, correction/reversal scenario is what the market has in store, then by definition the current rebound would be expected to peter out somewhere below 21-Sep’s obviously key 2947 high. Given the magnitude of the secular bull market and the steepness and obviousness of Oct’s plunge, we discussed the likelihood of an equally extensive corrective rebound to the 61.8% retracement of Sep-Oct’s plunge or higher. Indeed, the forces that drove the secular bull trend won’t evaporate into thin air, but rather will take TIME to erode to the point of more protracted downside vulnerability. During this time and typically, a market provides exactly the type of corrective rebound we’re currently experiencing.
The 61.8% retrace of Sep-Oct’s 2947 – 2603 decline cuts across at 2811 on a log scale basis, so it has satisfied our minimum requirement within the PROSPECT of a broader peak/correction/reversal scenario. Continued trendy, impulsive strength above 21-Sep’s 2947 high is required to mitigate any bearish count and reinstate the secular bull. We’re calling this key 2811 – 2947-range our Rubber-Meets-the-Road Zone.
IF the secular bull is not resuming straight away and the past couple weeks’ recovery is the (B- or 2nd-Wave) correction within a broader peak/correction/reversal scenario, then a bearish divergence in this zone will be the first indication of such. And such a mo failure would provide an early and unique risk/reward condition and opportunity to take defensive measures and pare or neutralize bullish equity exposure.
Subsequent and relatively larger-degree proof of weakness below 02-Nov’s 2699 low will jeopardize the impulsive integrity of any bullish count, reinforce a bearish count and expose AT LEAST further and very likely emotional correction to the lower recesses of the past couple months’ range and quite possibly a protracted and very scary meltdown BELOW 29-Oct’s 2603 low. The time and much preferred opportunity to take defensive if not outright bearish steps is NOT after increasingly obvious weakness below 2699 or 29-Oct’s 2603 low, but rather “up here” around this Rubber-Meets-the-Road Zone between 2811 and 2947 IF and when the market stems the clear and present intermediate-term uptrend with a bearish divergence in momentum.

The weekly log chart below shows the magnitude of the secular bull market and the three previous scary declines. What’s indeterminable at this juncture with the market still below 21-Sep’s 2947 all-time high is whether the correction lower ENDED at 29-Oct’s 2603 low (which would then be expected to be followed by sustained gains straight away; i.e. NO bearish divergence in momentum “up here”) OR if that 2603 low completed only the INITIAL A- or 1st-Wave of a correction or reversal lateral-to-lower that would next be expected to produce another round of steep losses and even more scary, emotional bearishness, exactly like that that unfolded in Mar/Apr of this year and Nov’15-to-Feb’16. We tried to “map out” with arrows below the three paths we believe the market will take in the months ahead. Two of them will be painful if you ignore the peak/reversal conditions we’ve discussed here and maintain a bullish stance.
In sum, the market is not devoid of technical factors that could be very bullish (i.e. 3-wave corrective decline, rejected Fibonacci levels and historically bearish sentiment). BUT IF 29-Oct’s 2603 low completed the correction, then its incumbent on the resumed secular bull to continue to provide trendy, impulsive behavior straight away and to eventual new highs above 21-Sep’s 2947 high. If, alternatively, the market stems the clear and present uptrend with a bearish divergence in momentum from the current 2811-to-2947-range, then traders will be urged to pare or neutralize bullish equity exposure commensurate with their personal risk profiles in order to reduce or circumvent the risk of a more significant intra-range relapse or resumption of Sep-Oct’s decline to potentially extensive losses below 2603. This current area of prices and technical condition is extraordinarily important and compelling.


