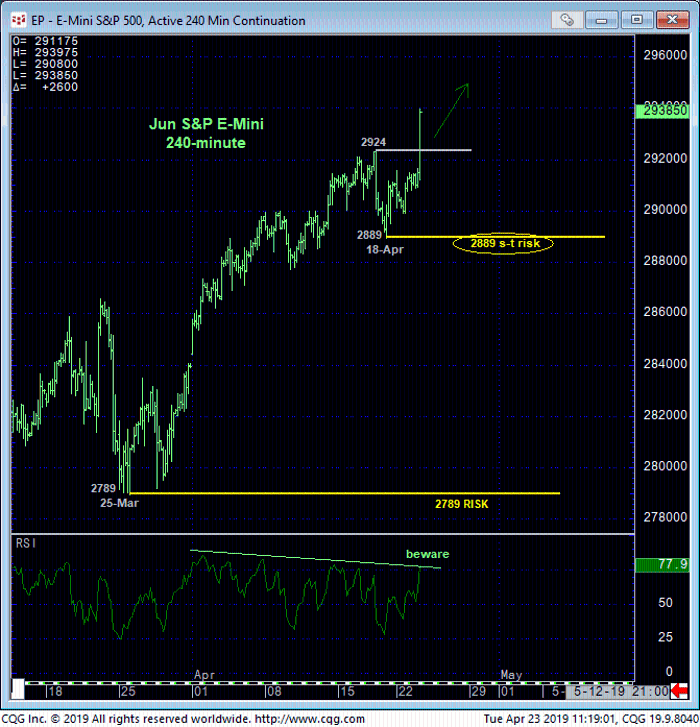

Today’s impressive, impulsive continuation of the bull above last week’s 2924 high obviously reinforces a bullish count, but its most important by-product is the definition of Thur’s 2889 low as the latest smaller-degree corrective low the market is now minimally required to fail below to confirm a bearish divergence in momentum and stem the rally. In this regard this 2889 level becomes our new short-term risk parameter from which a still-advised bullish policy and exposure can be objectively rebased and managed by shorter-term traders with tighter risk profiles.
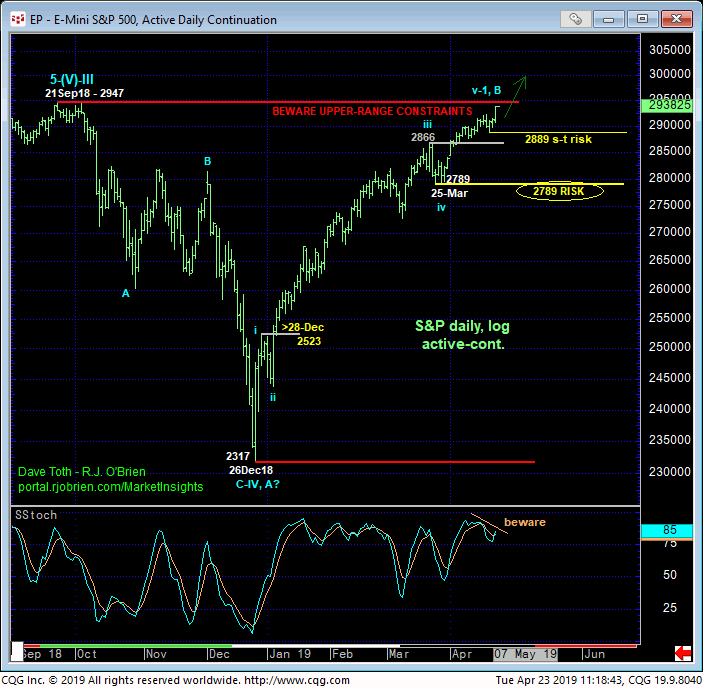
This tight but objective risk parameter may come in handy given the market’s close proximity to 21Sep18’s 2947 all-time high shown in the daily log chart below. If there’s a time and place for this market to fail, it’s here and now, and we will gauge such a failure by a relapse below 2889 specifically. Until and unless such sub-2889 weakness is shown, the trend remains up on all practical scales and should not surprise by its continuance or acceleration to new all-time highs above 2947.
From a longer-term perspective commensurately larger-degree weakness below 25-Mar’s 2789 larger-degree corrective low and key risk parameter remains required to break the major uptrend from Dec’s 2317 low and warrant paring or neutralizing long-term exposure.


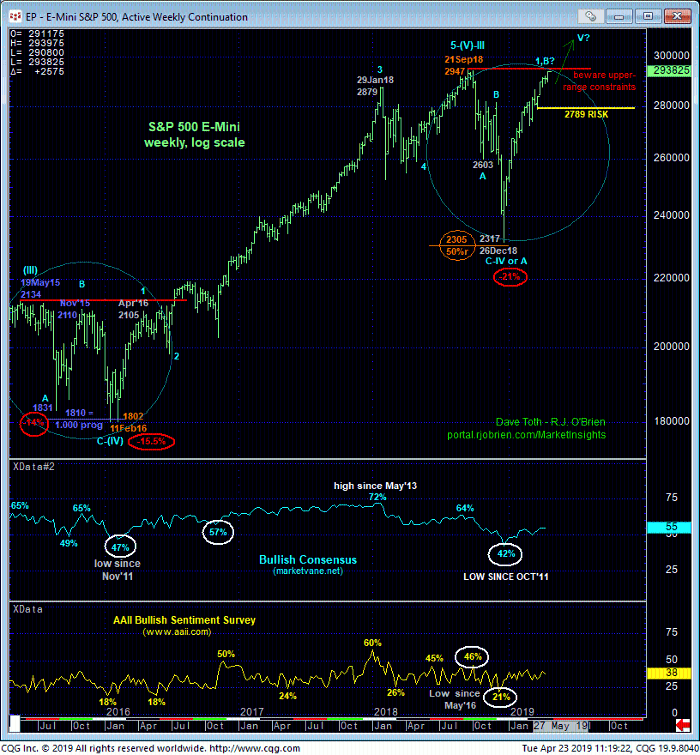
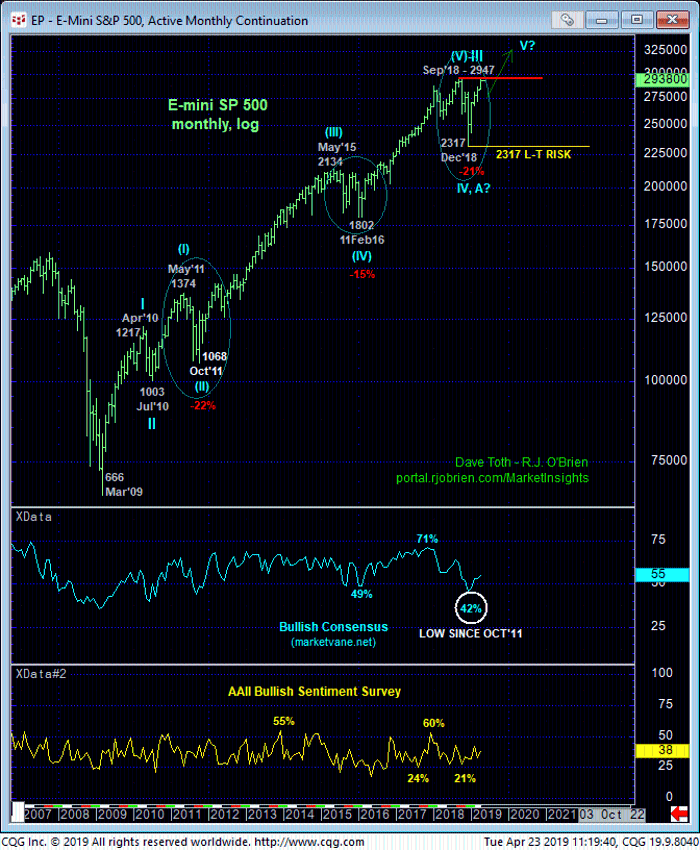
e weekly log chart above shows the market’s current position and condition that seems poised for new all-time highs. But we would remind traders of a similar condition in Nov’15 relative to May’15’s then-all-time high from which the market imploded. We won’t worry about a similar implosion this time until and unless the market fails below at least our longer-term risk parameter at 2789. Until then and against the backdrop of the secular bull market shown in the monthly log chart below, traders are advised to maintain a full and aggressive bullish policy ahead of expectations of new all-time highs and level indeterminately higher beyond last year’s 2947 high. A failure below 2889 is minimally required to threaten this call and warrant defensive steps commensurate with one’s personal risk profile.


