Posted on Oct 31, 2022, 08:22 by Dave Toth
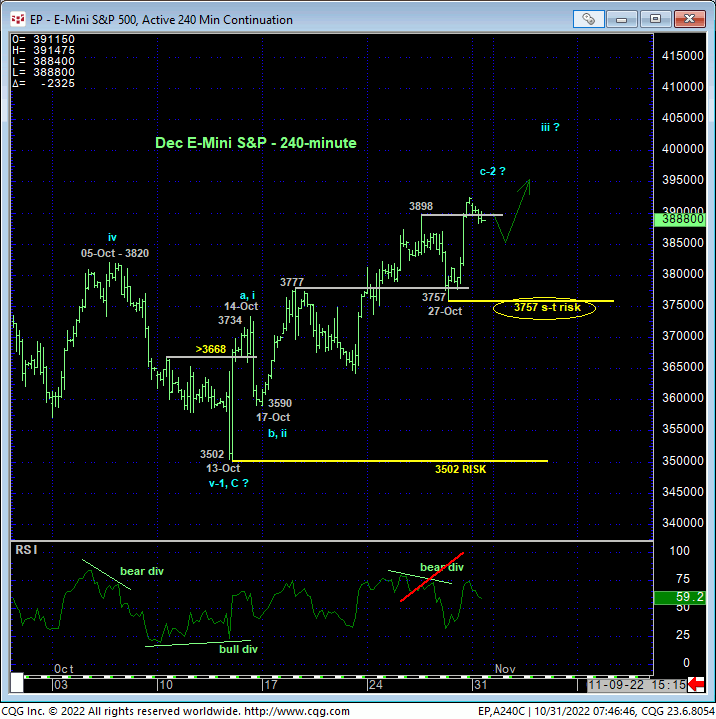
Fri’s continued recovery, this time above last Wed’s 3898 high, nullified a bearish divergence in very short-term momentum discussed in Fri morning’s Technical Blog and reaffirmed what we believe is an interim bear market rally count introduced in 13-Oct’s Technical Blog. As a direct result of Fri’s continued rebound, the 240-min chart below shows that the market has identified Thur’s 3757 low as the latest smaller-degree corrective low and new short-term risk parameter the market is now required to sustain gains above to maintain a more immediate bullish count. Its failure to do so confirm a bearish divergence in momentum, break the uptrend from at least 17-Oct’s 3590 low and possibly re-expose the secular bear trend. Per such, 3757 is considered our new short-term risk parameter from which non-bearish decisions like short-covers and cautious bullish punts can be objectively rebased and managed.
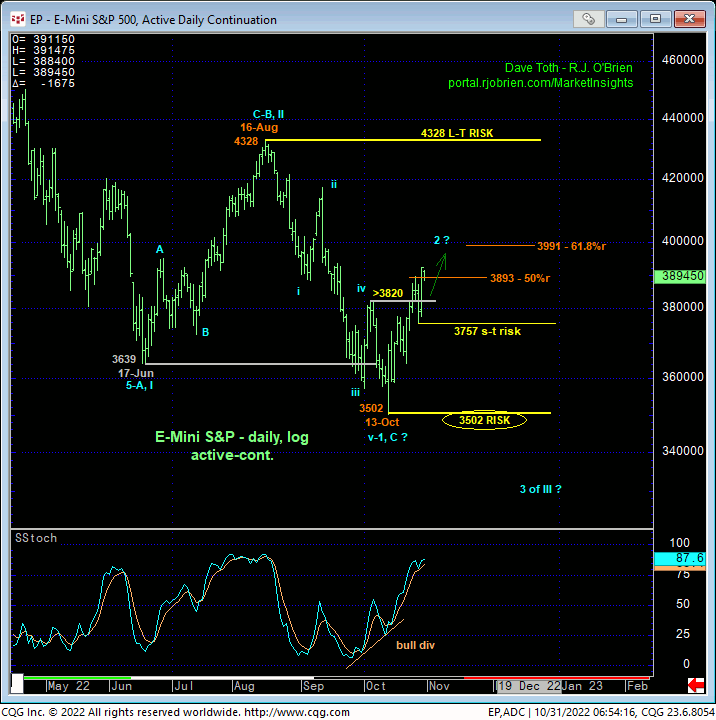
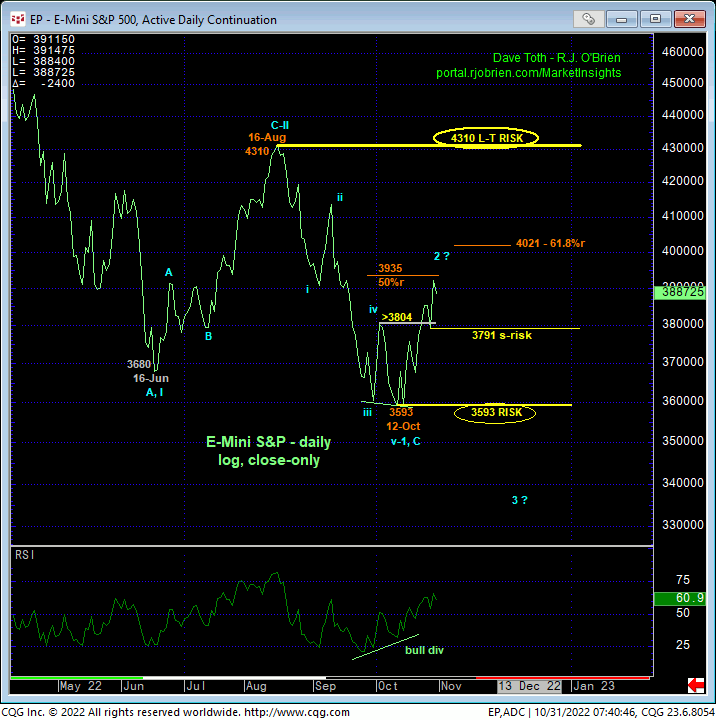
On a broader daily log scale basis, the bar chart above and close-only chart below show the evolution of the recovery that began with 13-Oct’s bullish divergence in short-term momentum and was reinforced by 25-Oct’s bullish divergence in daily momentum. Clearly, the trend is up on an intermediate-term basis with a failure below at least Thur’s 3757 intra-day low and/or a close below that day’s 3791 corrective low close required to arrest this rebound and expose at least an interim corrective relapse and possibly this year’s secular bear trend.
In effect, the short-to-intermediate-term trend is up within the still-arguable major downtrend that reminds us of the key technical and trading issue of SCALE. This month’s recovery is certainly encouraging to bulls. But given the extent and impulsiveness of Aug-Oct’s resumption of the major bear trend to levels below 17-Jun’s 3639 low, the market has defined 16-Aug’s 4328 intra-day high and that day’s 4310 high close as THE major corrective high and long-term risk parameter it still needs to recoup to break this year’s major downtrend and chalk up Jan-Oct’s decline as a possibly complete and major bull market correction. Until and unless such commensurately larger-degree strength is shown, this month’s recovery attempt remains well within the bounds of another correction similar to Jun-Aug’s correction of Jan-Jun’s decline. A short-term failure below Thur’s intra-day 3757 low and/or a close below 3791 will be the first smaller-degree threat against any alternate bullish count and resurrect a broader bearish count.
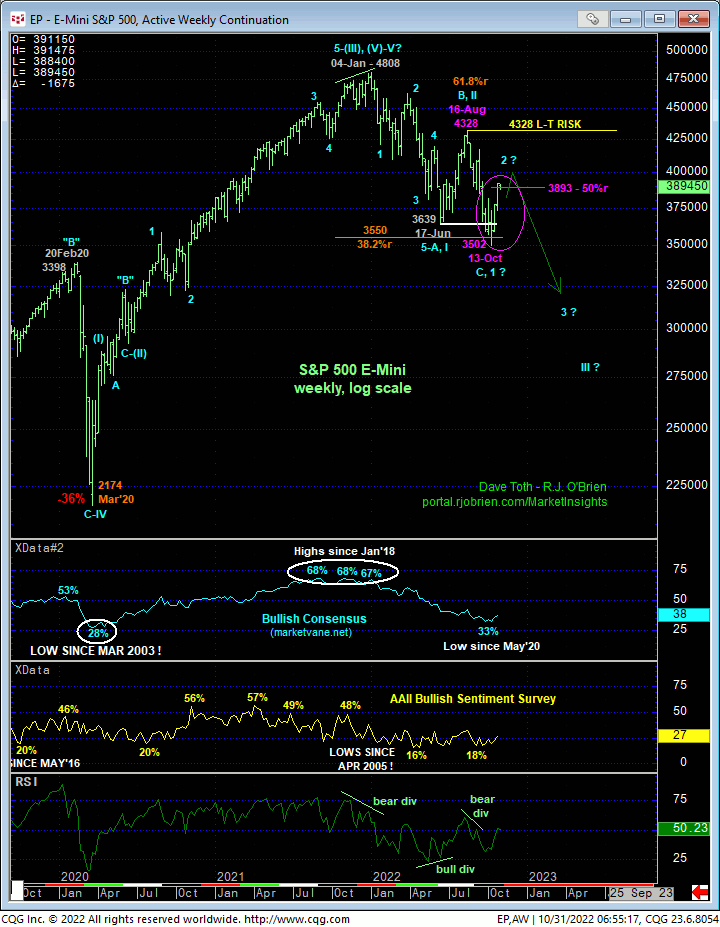
Once again and on an even longer-term scale, the weekly log chart above shows this year’s major peak/reversal process and the prospect that this month’s recovery is a mere correction within the secular bear trend similar to Jul-Aug 2008’s 50% retracement/correction within that year’s dramatic 3rd-Wave portion of the entire 2007 – 2009 bear market. This perspective highlights the critical issue of SCALE while navigating the current and clear recovery. If we are totally wrong on our long-term bearish count and if 13-Oct’s 3502 low completed a major correction within a resuming secular bull trend, then it is imperative for the bull to BEHAVE LIKE ONE by sustaining trendy, impulsive price action higher. A short-term intra-day failure below 3757 and/or a close below 3791 won’t necessarily negate a broader bullish count, but it would 1) be an initial strike against it and 2) reject/define a more reliable high and resistance from which to objectively gauge the market’s downside intentions, including a resumption of the secular bear trend.
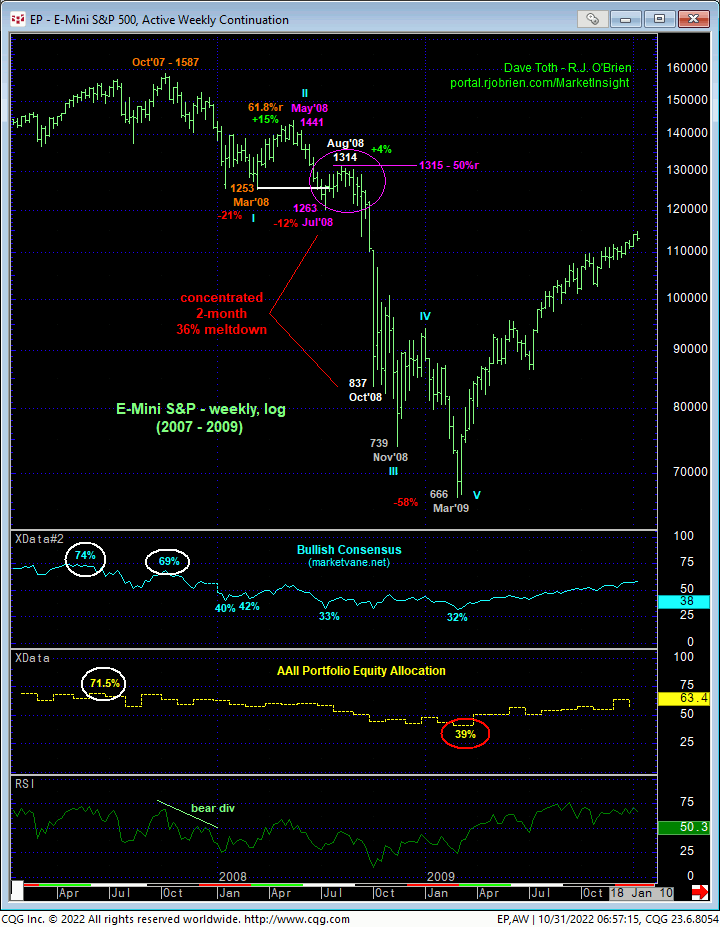
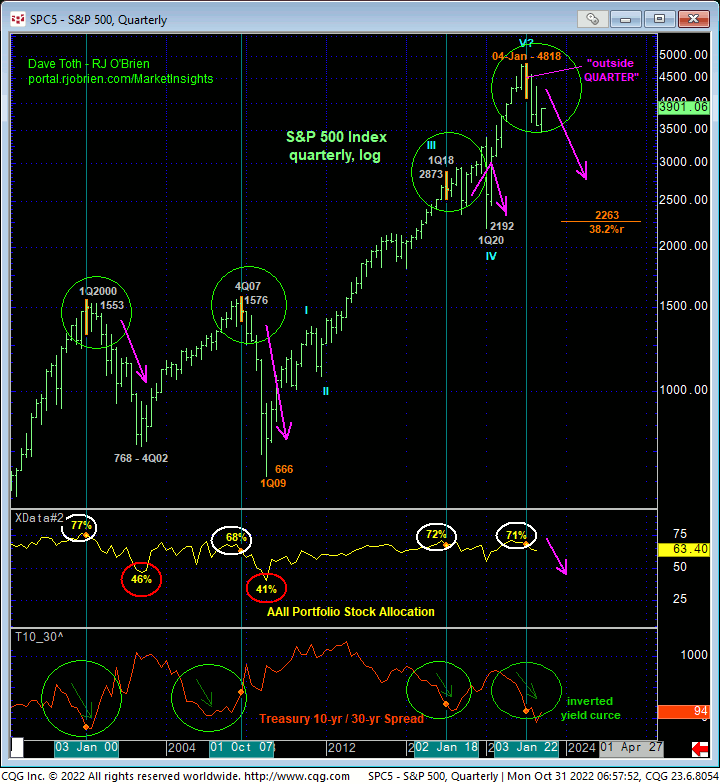
Finally and while reiterating the encouraging nature of this month’s rebound, this rebound is of an insufficient scale thus far to mitigate the long-term elements on which our major peak/reversal count is predicated:
- bearish divergences in weekly and monthly momentum back in Jan
- “outside” week, month and quarter the week, month and quarter of 04Jan22’s 4818 high
- historically extreme bullish sentiment
- inverted Treasury yield curve
- a complete 5-wave Elliott sequence from Mar’20’s 2174 low AND an arguably complete and massive 5-wave sequence from Mar 2009’s 666 low.
- the extent and 5-wave impulsiveness of Jan-Jun’s initial counter-trend decline, and
- 3-wave corrective Jun-Aug recovery.
These technical facts and observations warned of and accompanied 2018 – 2020’s major consolidation and both the 2007 – 2009 and 2000 – 2002 major bear markets. To mitigate these long-term bearish factors and suggest “just” a major consolidation from Jan’s 4818 high, this market needs to recoup 16-Aug’s 4328 major corrective high and long-term bear risk parameter. Until and unless such 4328+ strength is proven, the recovery attempt from 13-Oct’s 3502 low falls well within the bounds of a (2nd-Wave) correction within a massive 3rd-Wave down from 4328 that warns of steep, dramatic losses below 3502 similar to Aug-Oct 2008’s 36% meltdown.
These issues considered, an interim cautious bullish stance remains OK with an intra-day failure below Thur’s 3757 low and/or a close below 3791 required to arrest this call and warrant moving to at least a neutral/sideline position if not a resumed bearish policy. In lieu of such weakness, further lateral-to-higher prices remain anticipated.
